US Dollar Index Price Analysis: DXY justifies weekly support break below 93.00
- DXY fades early Asian bounce, retreats from 92.84.
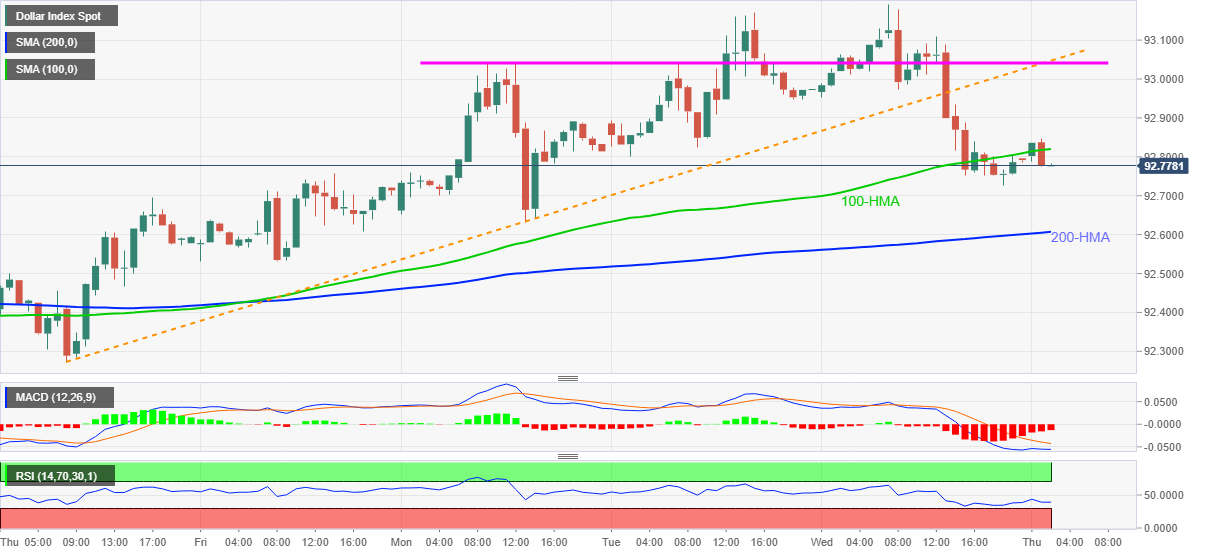
- 200-HMA challenges sellers, bulls need to cross 93.05 to retake controls.
US Dollar Index (DXY) retreats to 92.77, reversing initial gains, amid Thursday’s Asian session.
In doing so, the greenback gauge seesaws around 100-HMA while extending the previous day’s breakdown of an ascending support line, now resistance, from July 15.
Given the bearish MACD and downbeat RSI, not to forget the trend line breakdown, DXY may witness further declines targeting the 200-HMA level of 92.60.
However, bears may take a breather around 92.60, if not then the monthly low close to the 92.00 threshold should return to the charts.
Alternatively, the US Dollar Index buyers need to cross 93.05 resistance confluence, comprising a three-day-old horizontal line and previous support line, to jump back on the driver’s seat.
Following that, the yearly high surrounding 93.45 remains on the gains the market’s attention.
To sum up, DXY is up for a short-term pullback but the overall bullish trend isn’t reversed.
DXY: Hourly chart
Trend: Further weakness expected