S&P 500 (ES SPY) Technical Forecast: Buy the dip still the only show in town
- Equity markets start off Monday hungover from the Fed.
- Reality quickly dawns that this is a dip and it should be bought.
- Stocks rally in the afternoon to impressive gains.
Monday's price action confirmed the buy the dip strategy is still the only gig in equity land as the Fed and Bullard dip was quickly devoured by hungry bulls. The 15-minute chart below shows the lift-off just after lunchtime on Monday.-637599504010851875.png) rice
rice
S&P 500 (ES) forecast
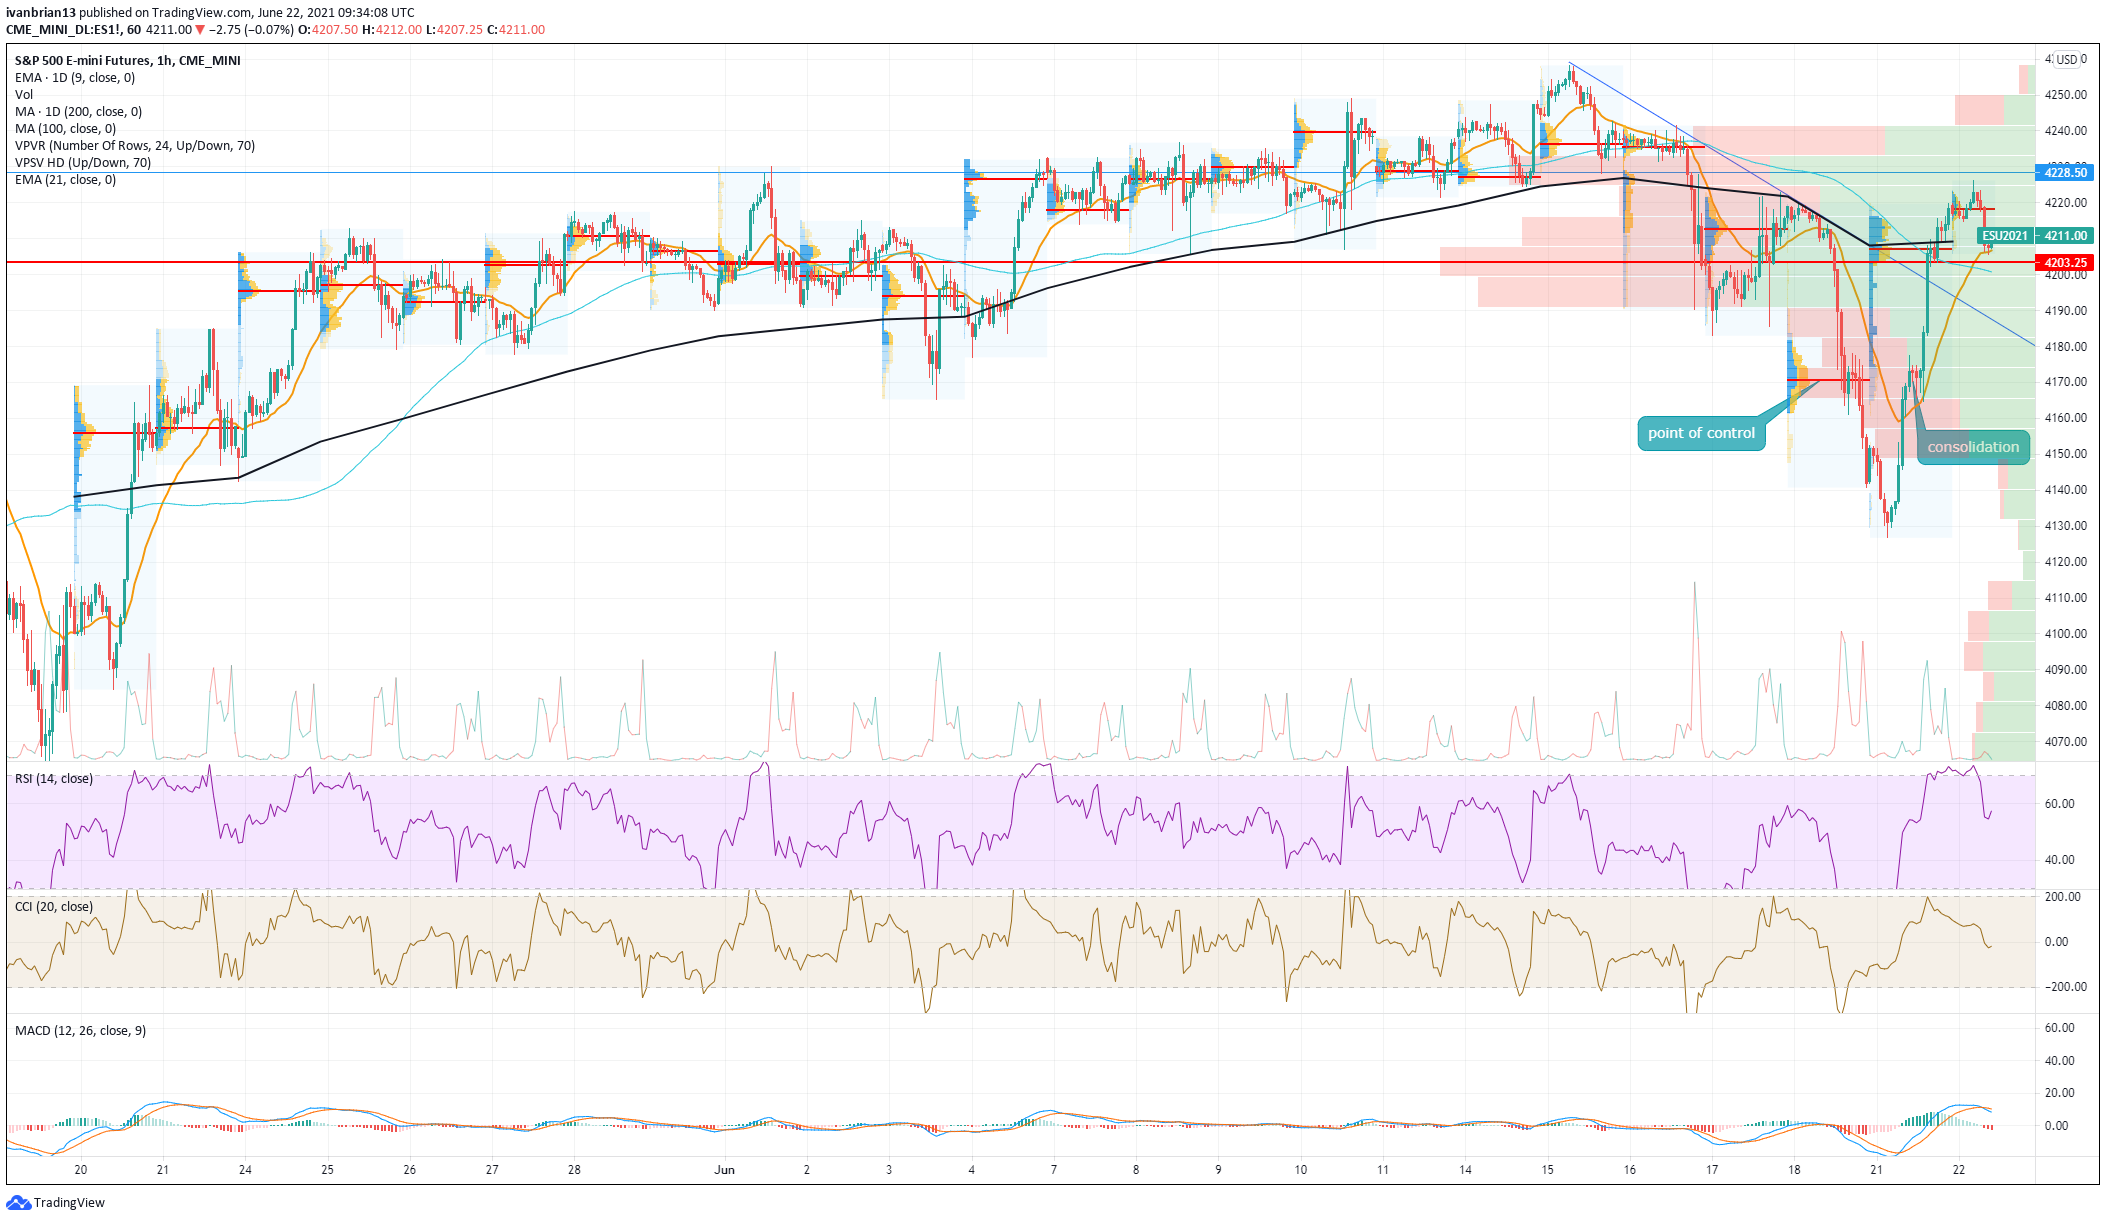
Monday's price action held or just about held the lower trendline support in place since October 2020. Every dip since and even before going back to the pandemic has been eagerly bought up by bulls and so far Monday's price action looks exactly the same. In order to confirm this is indeed a dip and not the start of something more bearish, we need to quickly retake the short-term moving averages, 9 and 21-day. The early price action on Tuesday is looking like this will likely happen but European markets are lower so it will be a tough slog. The hourly chart below shows the formation of a potentially bearish trend line so Tuesdays early push to break this is important for bulls. 4170 is a short-term area of support from the intraday volume profile. This is the point of control from Friday's fall and again where the move on Monday consolidated before breaking out. The point of control is the area with the highest volume concentration. 4170 is also where the longer-term trendline on the daily chart sits today so a strong support level.
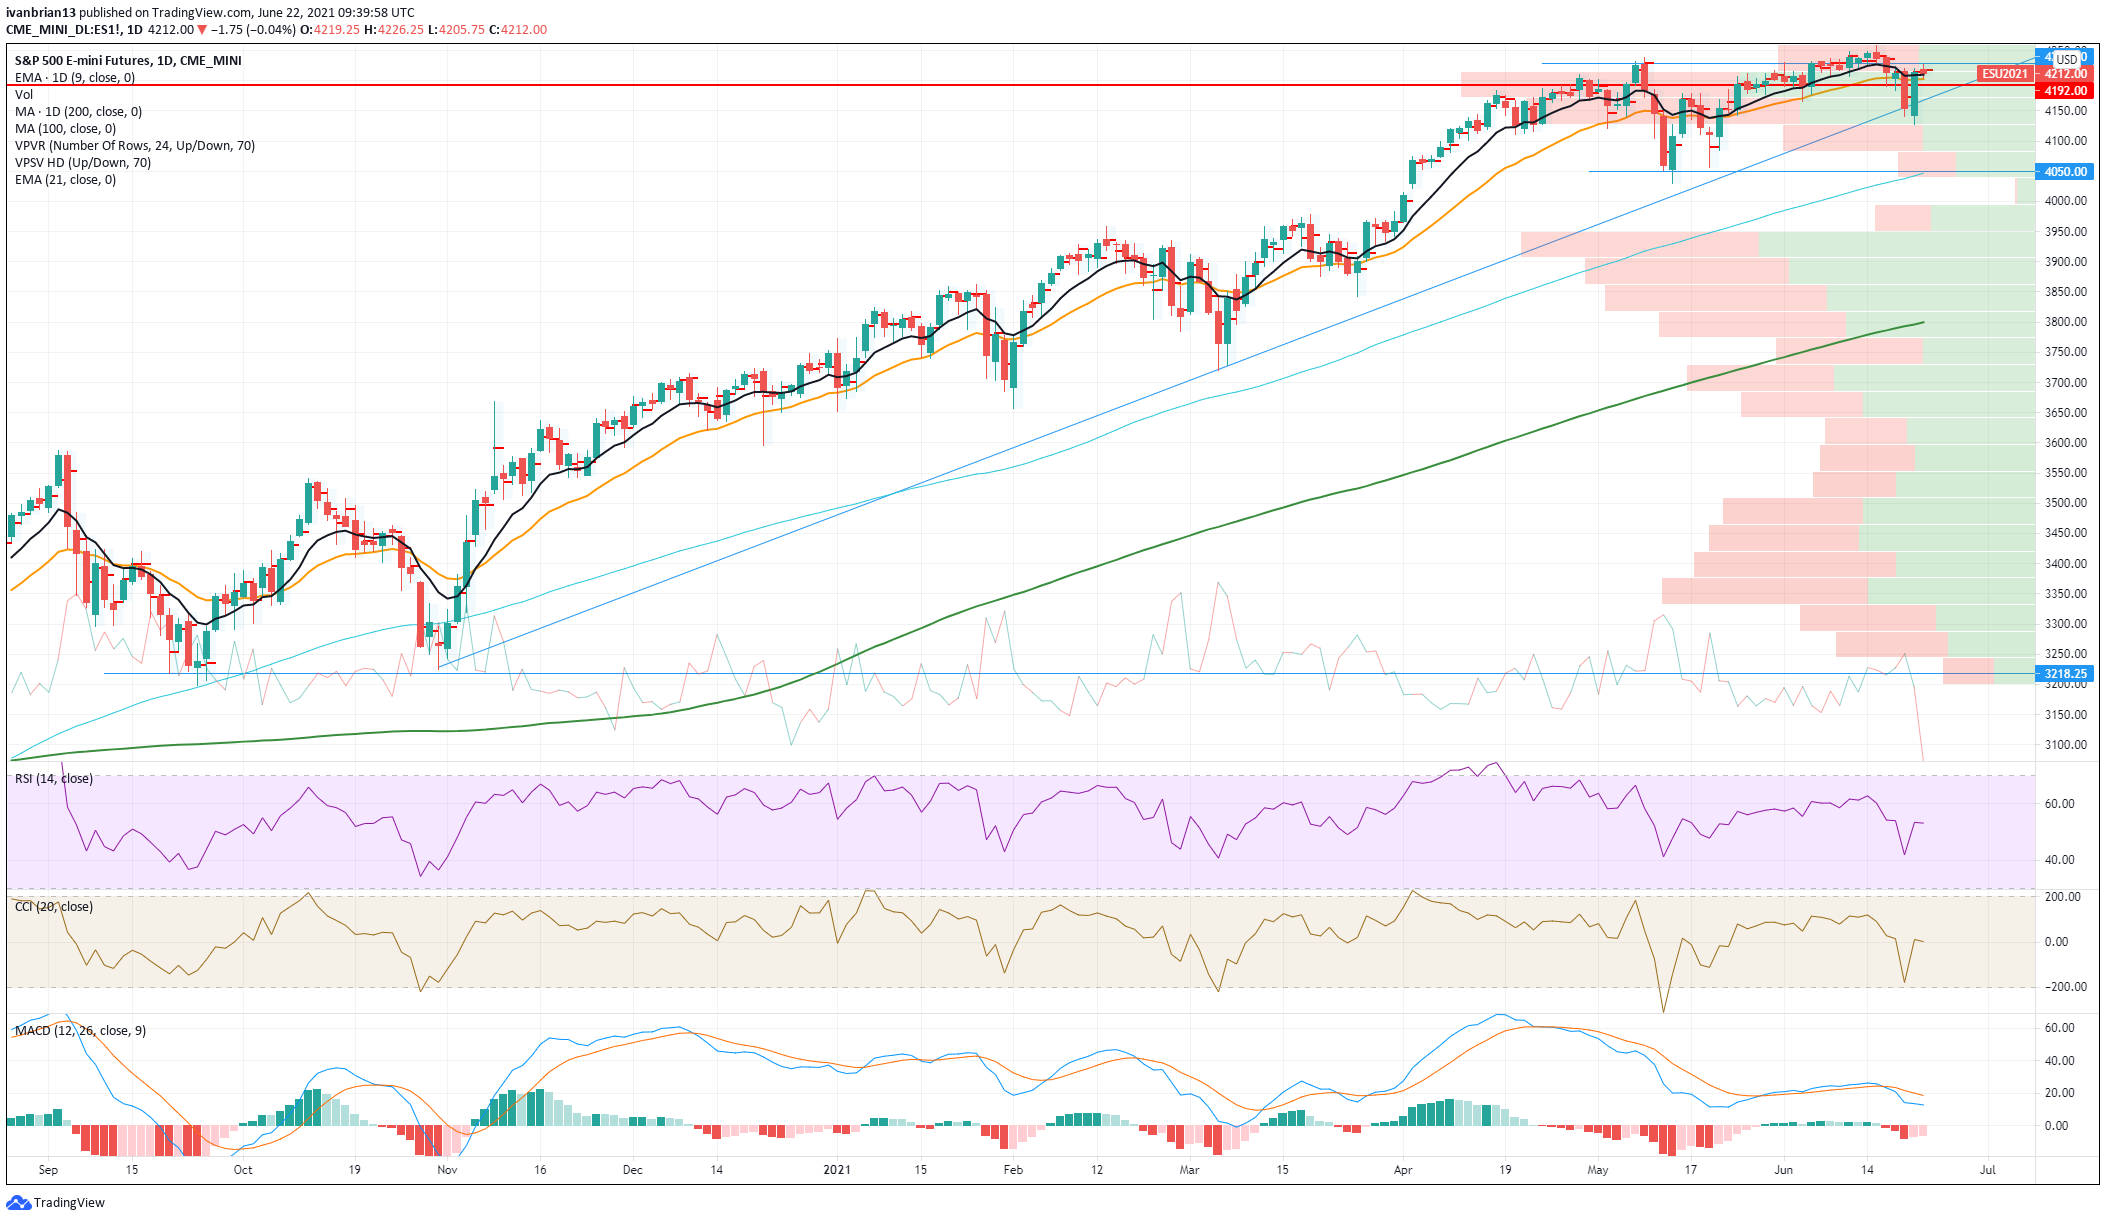
The daily chart shows the longer-term trendline at 4170 as mentioned where the S&P future (ES) bounced from and the key level of 4050, a break below is very negative and should quickly move to 3950 given how clearly we can see the volume profile dry up on the right of the chart. But above 4050 the risk-reward is still skewed to further upside given the strong trend in play since March 2020.
Like this article? Help us with some feedback by answering this survey: