USD/CAD Price Analysis: Bulls struggle to keep recoveries beyond 1.3200
- USD/CAD eases from 1.3227 while defying the bounce off late-January lows.
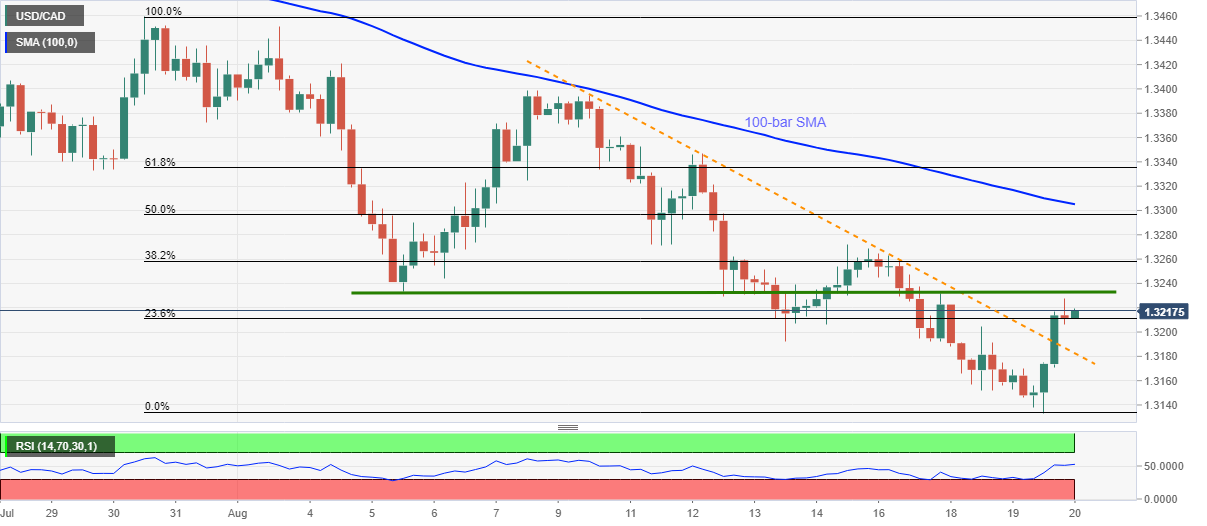
- Short-term horizontal resistance questions the break of an eight-day-old falling trend line.
- Sellers may attack 1.3100, bulls will have 100-bar SMA as an additional upside barrier.
USD/CAD fails to keep the upside momentum despite marking notable gains from the multi-month lows the previous day, also backed by a clear break of short-term resistance line, during the early Thursday.
The loonie pair stays below a horizontal area comprising multiple levels since August 05 while taking rounds to 1.3210/15 by the press time. Although RSI pullback from the oversold area favors the bulls, any fresh buying may wait for 1.3215.
Even so, 50% Fibonacci retracement of July 30 to August 19 fall, near 1.3295, will precede a 100-bar SMA level of 1.3305 to keep the optimists pressured ahead of 1.3335 figures including 61.8% of Fibonacci retracement.
On the downside, the pair’s declines below 1.3180, marking the resistance-turned-support trend line from August 10, will refresh the multi-week low while aiming 1.3100.
It should, however, be noted that multiple levels stand between 1.3100 and the yearly low of 1.2950, the 1.3000 being the strongest one, that will offer a bumpy road for the bears during the major downside.
USD/CAD four-hour chart
Trend: Pullback expected