AUD/JPY Price Analysis: Bearish spinning top portrays sellers’ exhaustion
- AUD/JPY remains under pressure for the first consecutive day.
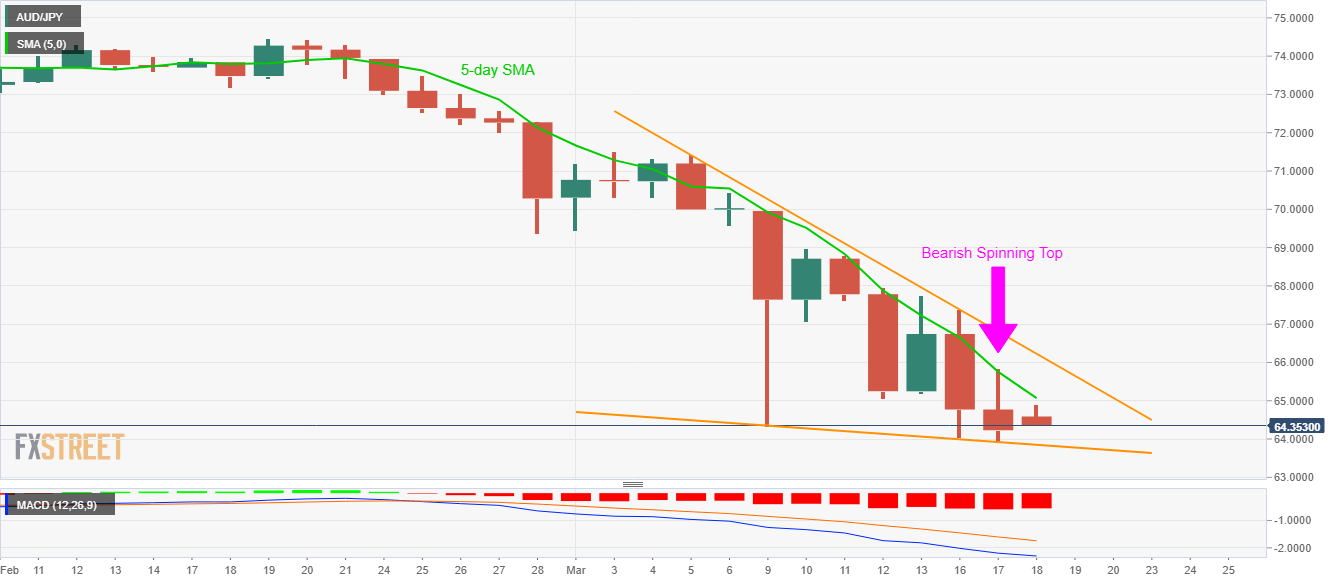
- The candlestick on the daily chart suggests sellers’ exhaustion, a pullback move.
- 5-day SMA, monthly resistance line restrict immediate recovery.
While extending its declines for the third day in a row, AUD/JPY drops to 64.35 amid the early Asian session on Wednesday. Even so, the pair portrays sellers’ exhaustion on the daily chart suggesting bounces off the short-term support line.
In a case where the bearish MACD drags the quote below the seven-day-old falling trend line, at 63.85, the sellers could take further steps to inch closer towards 63.00 whereas early- February 2009 tops near 62.60 might entertain the sellers afterward.
On the upside, 5-day SMA offers the immediate resistance around 65.10 while the monthly falling trend line, currently near 66.25, can question the bulls then after.
In a case where the buyers manage to cross 66.25 on a daily closing basis, they confirm the short-term bullish technical formation, namely falling wedge, which in turn could trigger the fresh run-up towards the monthly top near 71.40/45.
AUD/JPY daily chart
Trend: Pullback expected