GBP/USD Price Analysis: Aims to revisit 200-hour SMA, immediate support trendline
- GBP/USD pulls back from 50% Fibonacci retracement.
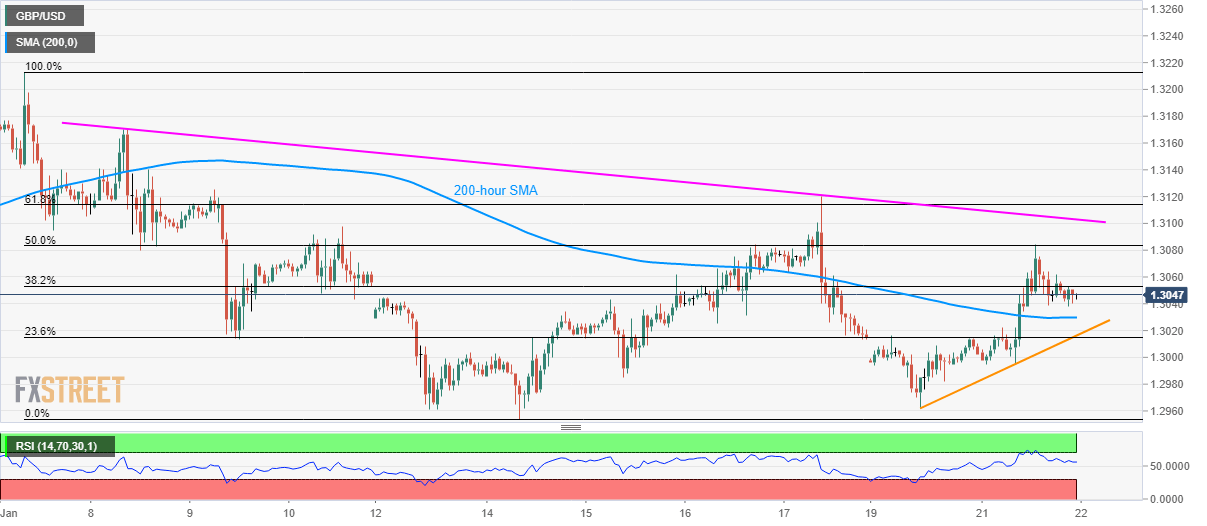
- A two-week-old falling trend line adds to the resistance.
- 1.3000 round-figure will also play its role as the support.
GBP/USD registers mild losses while trading around 1.3045 during Wednesday’s Asian session. The pair earlier reversed from 50% Fibonacci retracement of its fall from January 07 to 14.
With this, sellers eye 200-hour SMA level of 1.3030 as the immediate support ahead of the two-day-old rising trend line, at 1.3015. Also supporting the pair will be 1.3000 mark.
In a case where the bears dominate below 1.3000, the monthly low surrounding 1.2955 will return to the chart.
On the upside, pair’s break of 50% Fibonacci retracement, at 1.3085, needs to clear short-term falling resistance line, near 1.3105, to justify its strength in challenging 61.8% of Fibonacci retracement around 1.3115.
If at all prices remain strong beyond 1.3115, 1.3165 and 1.3200 could lure the bulls.
GBP/USD hourly chart
Trend: Bearish