Back
21 Jan 2020
EUR/USD Price Analysis: Euro rolling into Asia below the 1.1100 level
- EUR/USD remains under pressure below the 1.1121 resistance.
- The level to beat for bears is the 1.1070 support.
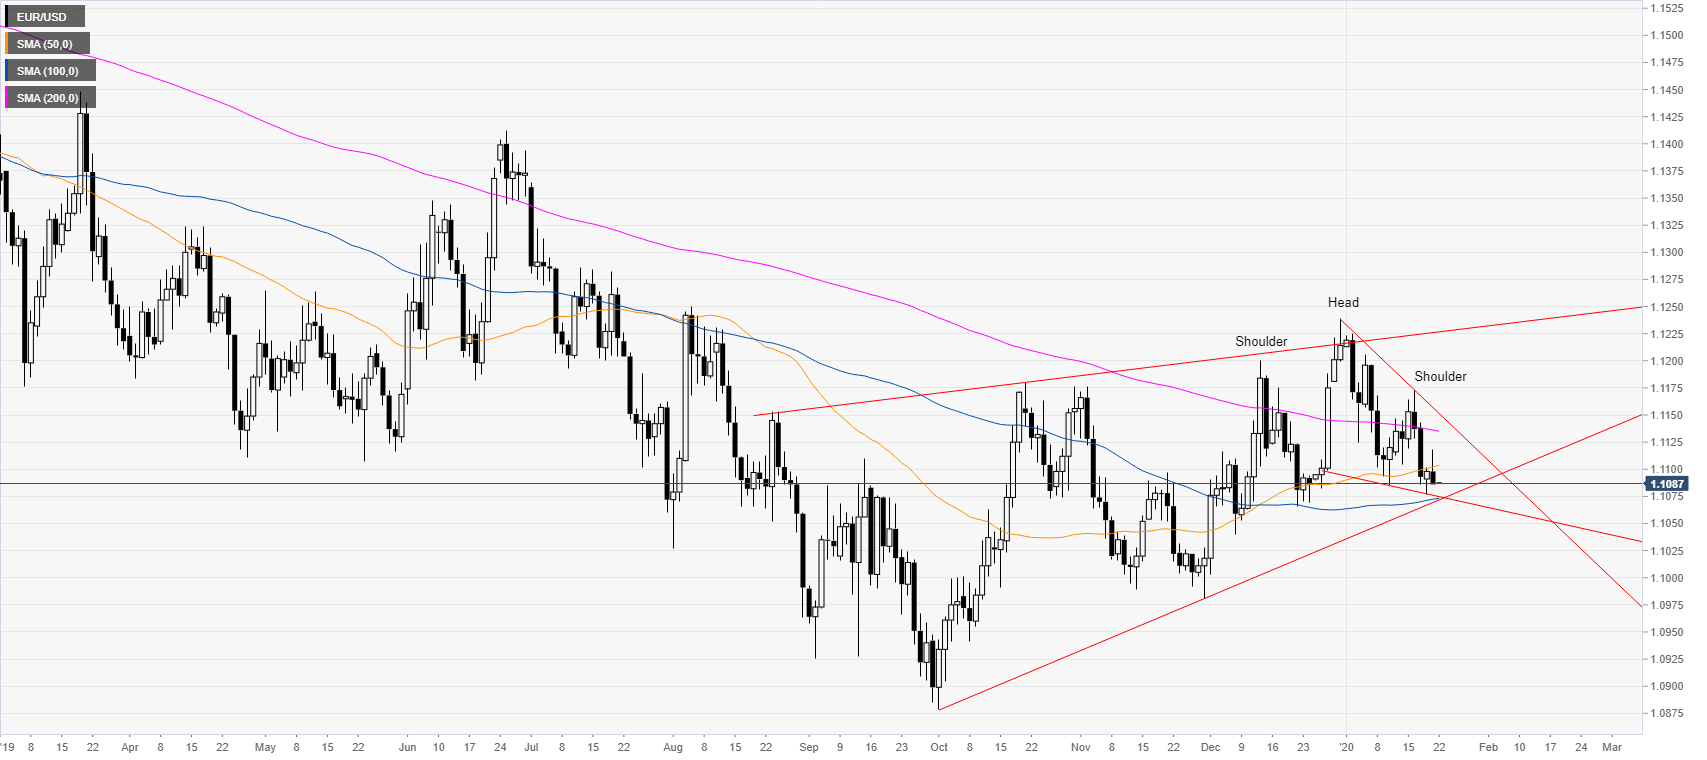
EUR/USD daily chart
The euro is trading in a weak downtrend below the 200-day simple moving average (SMA). However, the spot is trading in an ascending channel which started in October 2019. The spot is also within a bull flag since late December 2019. EUR/USD created a head-and-shoulders pattern and a break above the right shoulder near 1.1175 and the 200 SMA could be seen as a bullish continuation. However, since the market has been so two-sided in the last months of trading it is more probable that breakouts in either direction will not run very far.
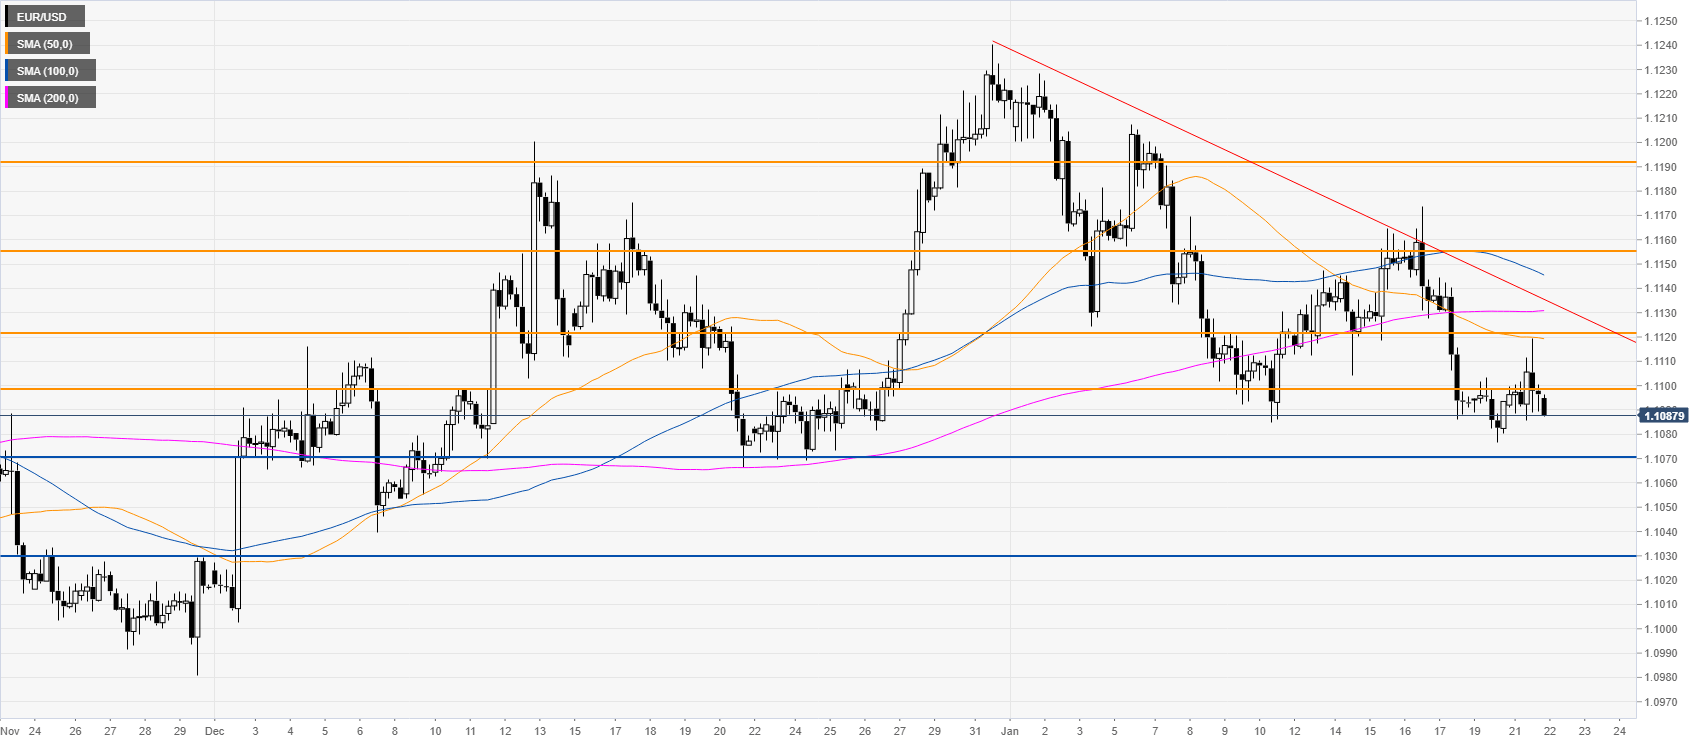
EUR/USD four-hour chart
As the market is trading below the main SMAs the underlying bias remains bearish. Sellers are looking for a clear breakdown below the 1.1070 support and a potential drop to the 1.1030 level. Resistances are seen near the 1.1098, 1.1121 and 1.1155 levels, according to the Technical Confluences Indicator.
Additional key levels