Back


2 Jan 2020
USD/INR Price Analysis: Greenback starting 2020 near 71.40 against Indian rupee
- USD/INR created a bear flag in the second part of December 2019.
- The level to beat for sellers is the 71.20 support.
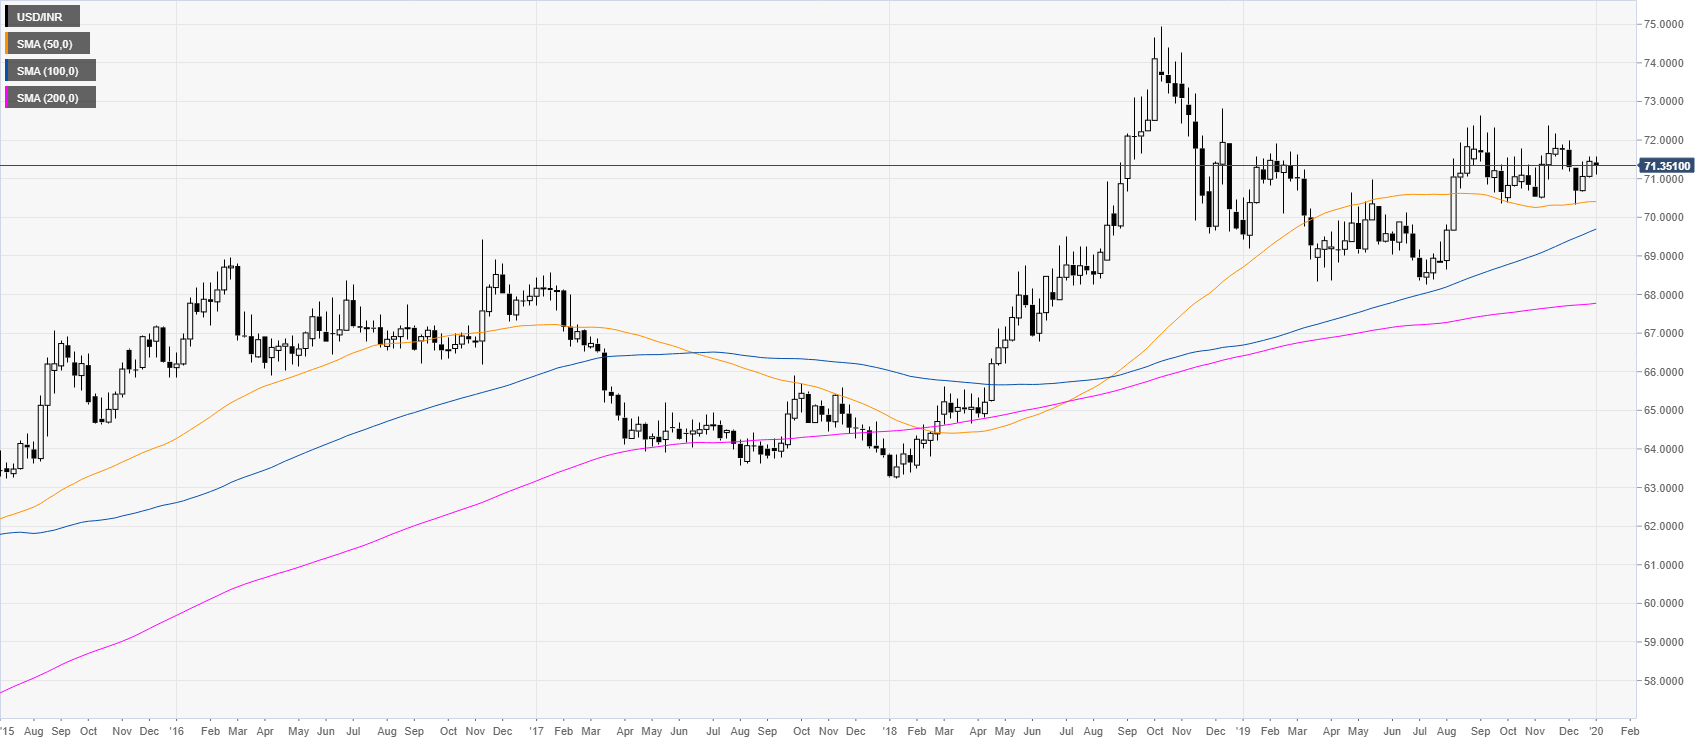
USD/INR weekly chart
In 2019, USD/INR has been consolidating the 2018 bull run while trading above the 100/200-period weekly simple moving averages.

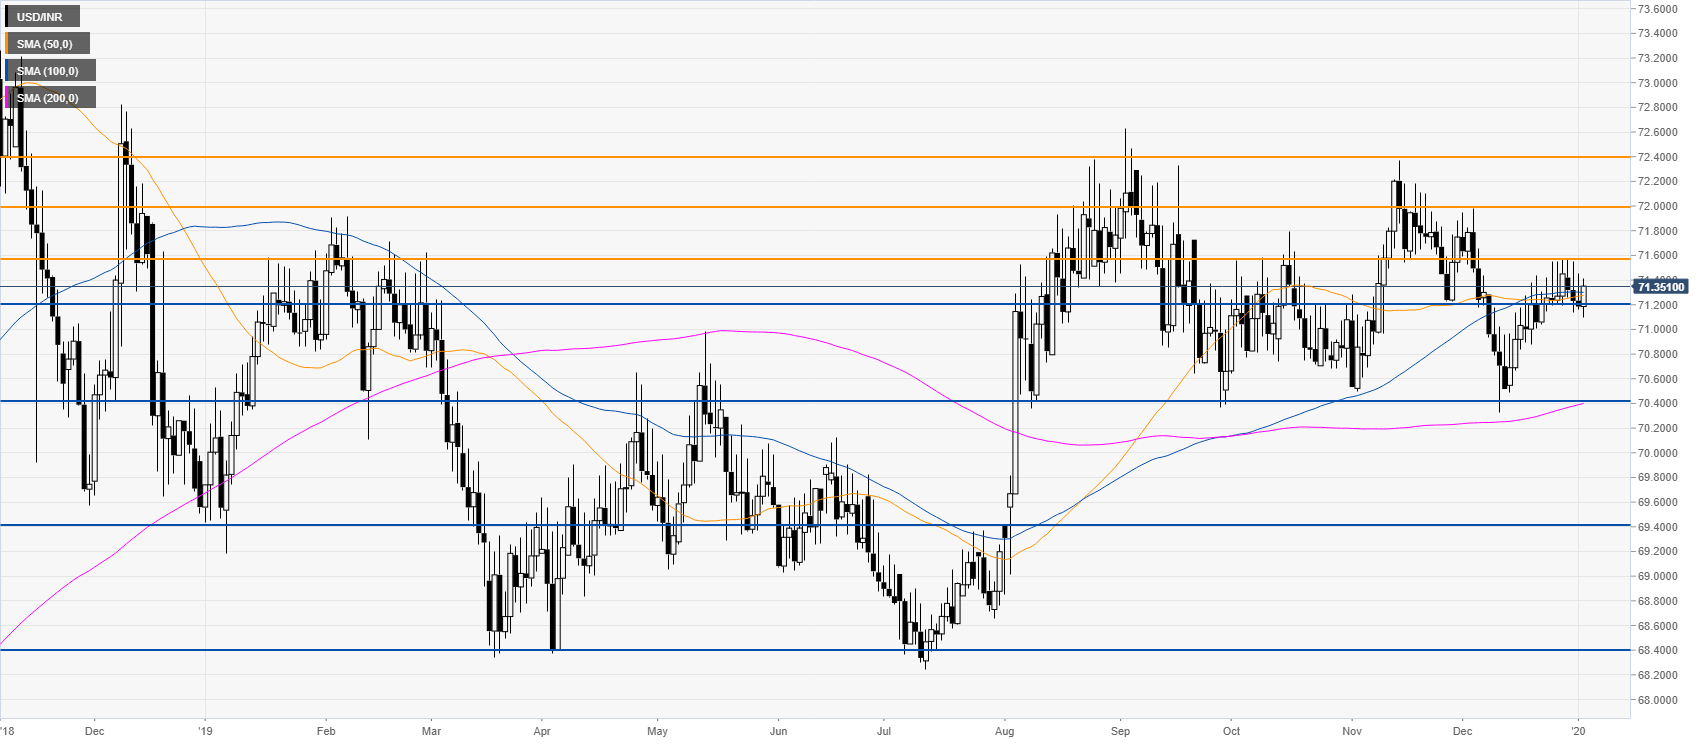
USD/INR daily chart
In the second part of December, the market formed a bear flag below the 71.60 resistance. A bearish break below the 71.20 support level can open the doors for a drop towards the 70.40 key support level. Then, if the sellers overcome 70.40, the market has room to fall to the 69.40 and 68.40 levels. Resistances can be seen near 71.60, 72.00 and 72.40 levels.

Additional key levels
