Back


30 Dec 2019
AUD/USD Price Analysis: Aussie pressuring five-month highs and the 0.7000 handle
- AUD/USD is about to end December on the high tick above the 0.7000 handle.
- The next resistances on the way up are seen near 0.7040 and 0.7055 price levels.
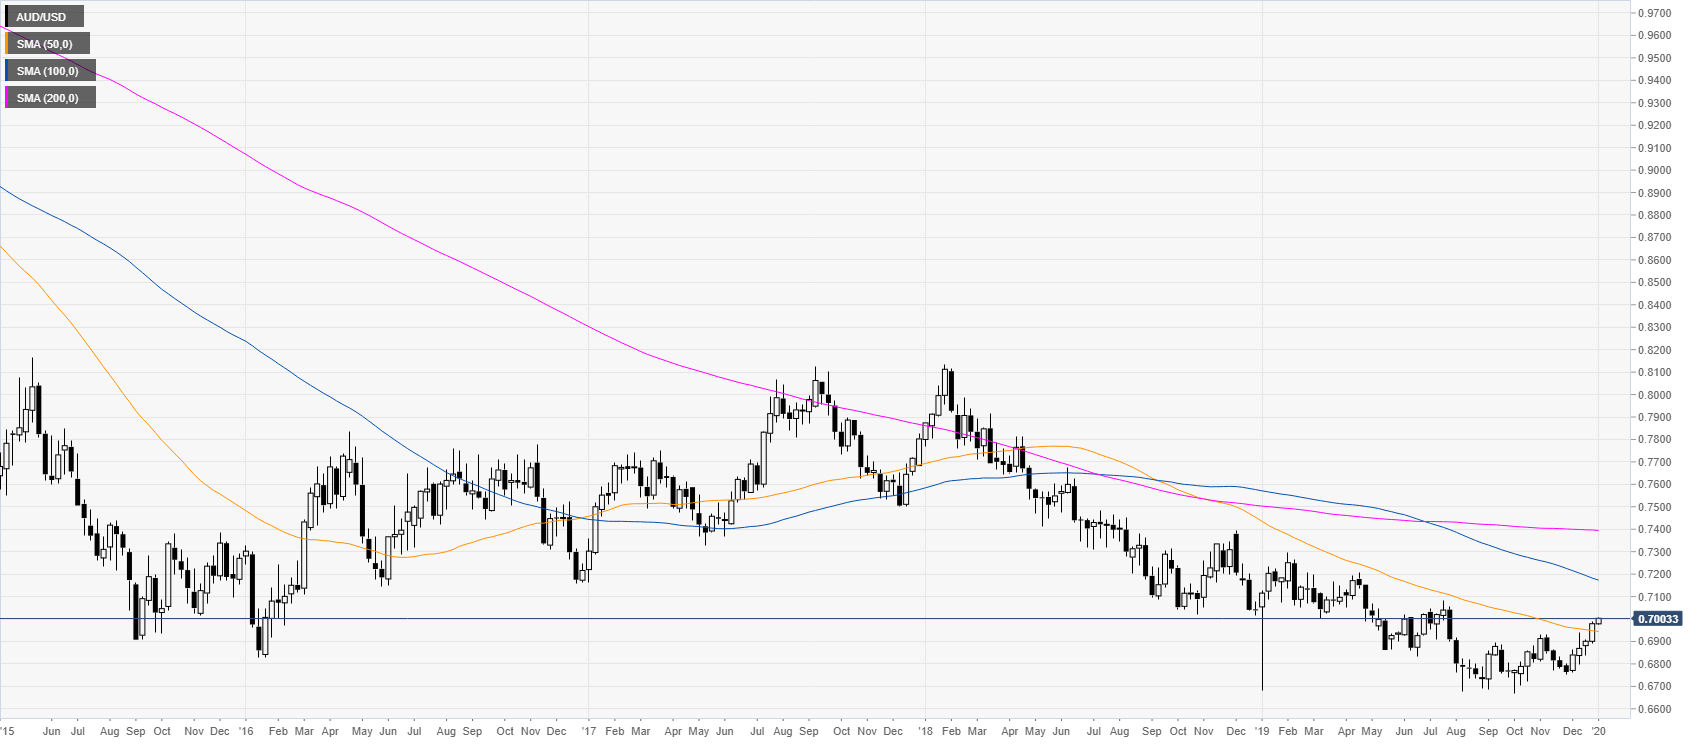
AUD/USD weekly chart
The aussie is about to end 2019 with a end-of-year rally above the 50-period weekly simple moving average (SMA). The spot has been under pressure in the first half of the year but from August onwards the market has started to give signs of a potential bottom. If the bulls maintain the market above the 0.6700 handle, 2020 will be sideways to up.

AUD/USD daily chart
AUD/USD is challenging the 0.7000 handle while trading above the 200-day simple moving average (DMA). In 2020, bulls will likely try to reach the 0.7100, 0.7200 and 0.7300 handle on the way up. On the flip side, a successful break below the 0.6700 figure could be seen as a bearish continuation.

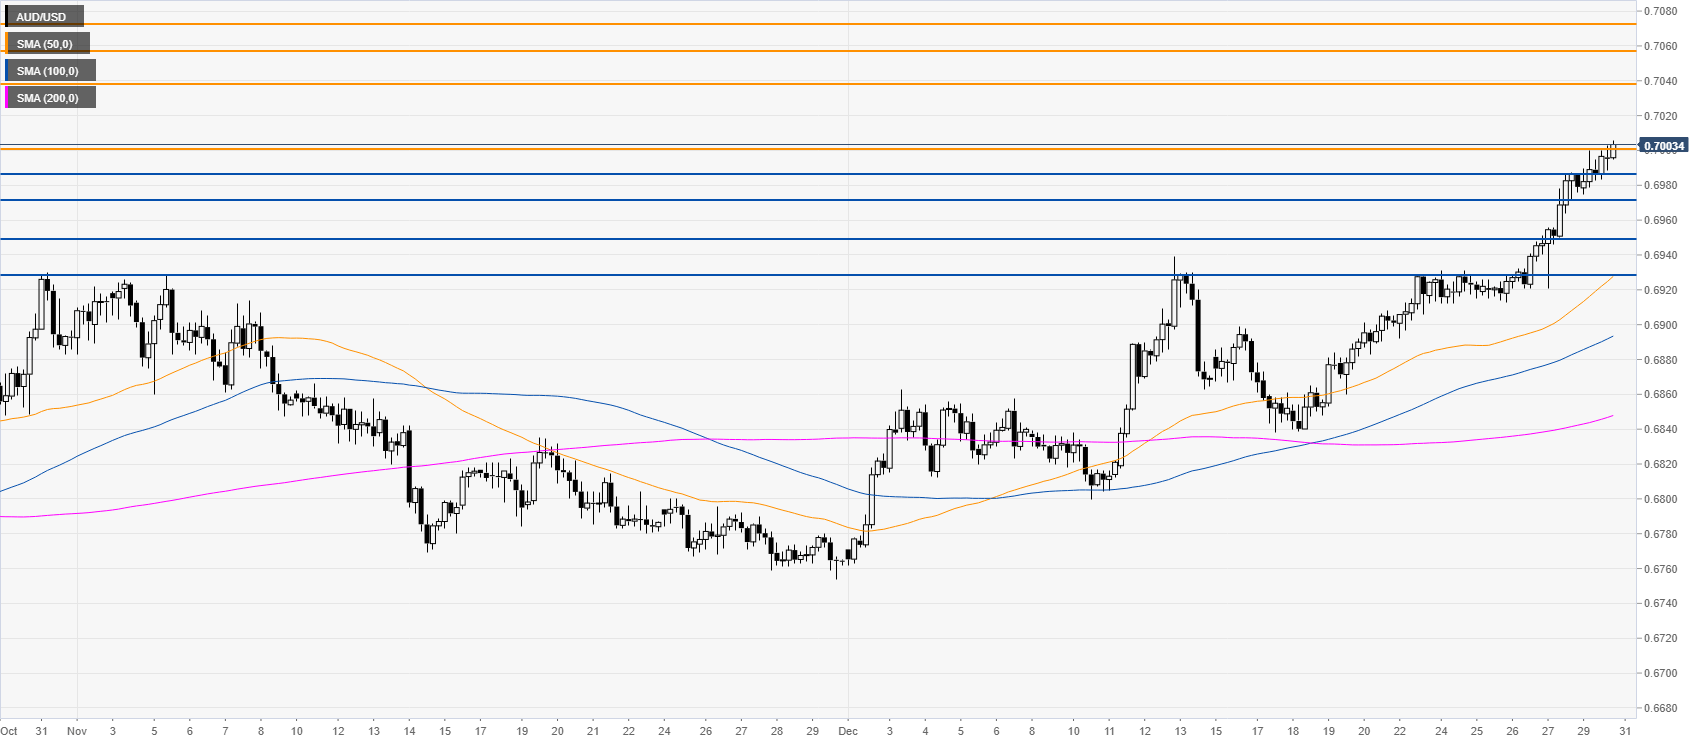
AUD/USD four-hour chart
The market is spiking up while above the main SMAs. As the bulls are pressuring the 0.7000 figure the market is set to climb towards 0.7040, 0.7055 and 0.7072, according to the Technical Confluences Indicator. Support can be found at 0.6985, 0.6967, 0.6952 and 0.6930 price levels.

Additional key levels
