Back
19 Sep 2019
US Dollar Index technical analysis: DXY jumps and hits 98.68 on hawkish Fed’s rate cut
- The Greenback spiked up following the hawkish Fed's rate cut.
- The level to beat for bulls is the 98.68 resistance.
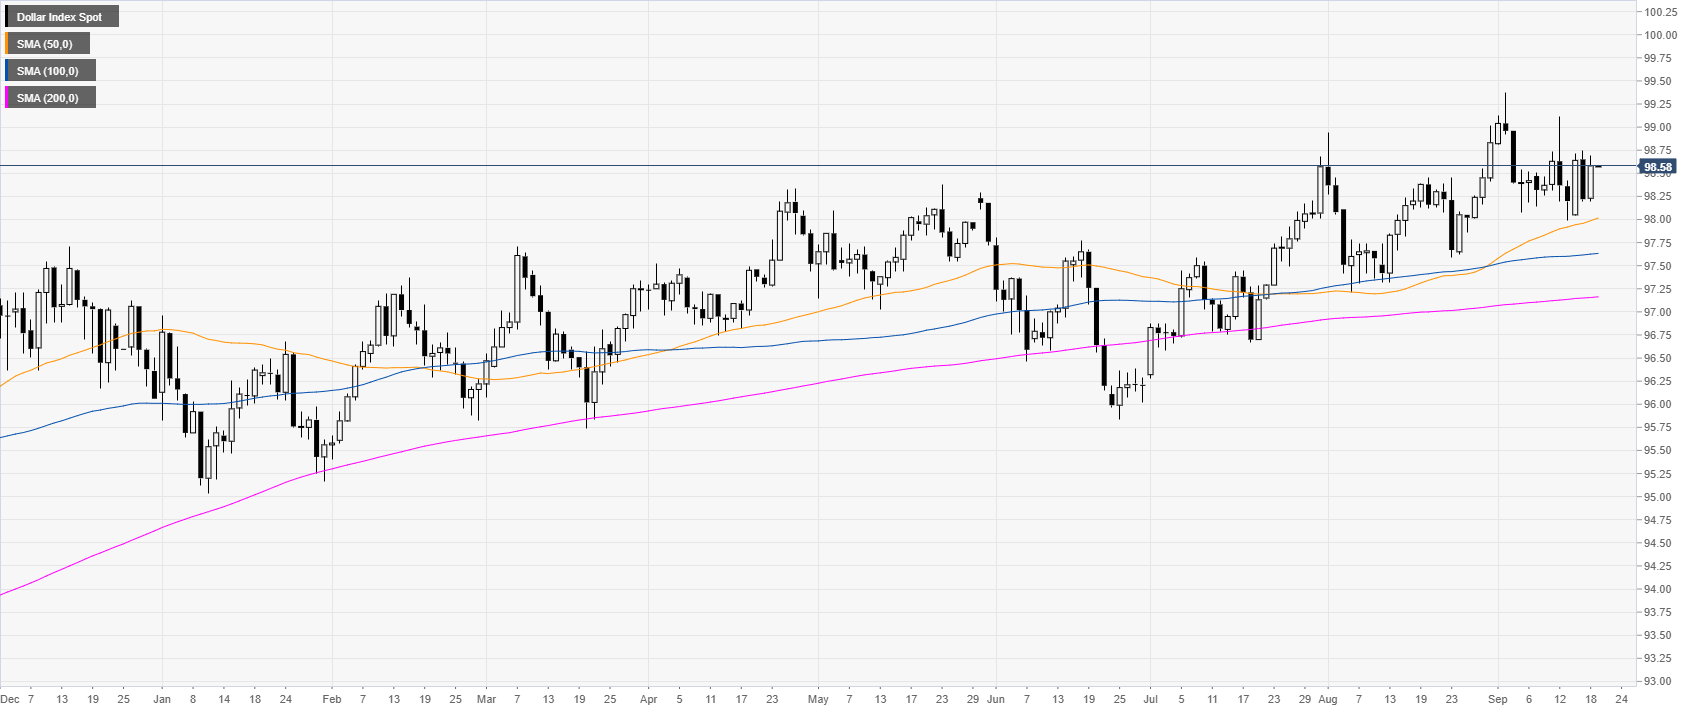
DXY daily chart
DXY (US Dollar Index) is trading in a bull trend above the main daily simple moving averages (DSMAs). The Buck has been trading in a trading range over the last two weeks. The Fed has cut 25 bps as it was widely expected and DXY rose.
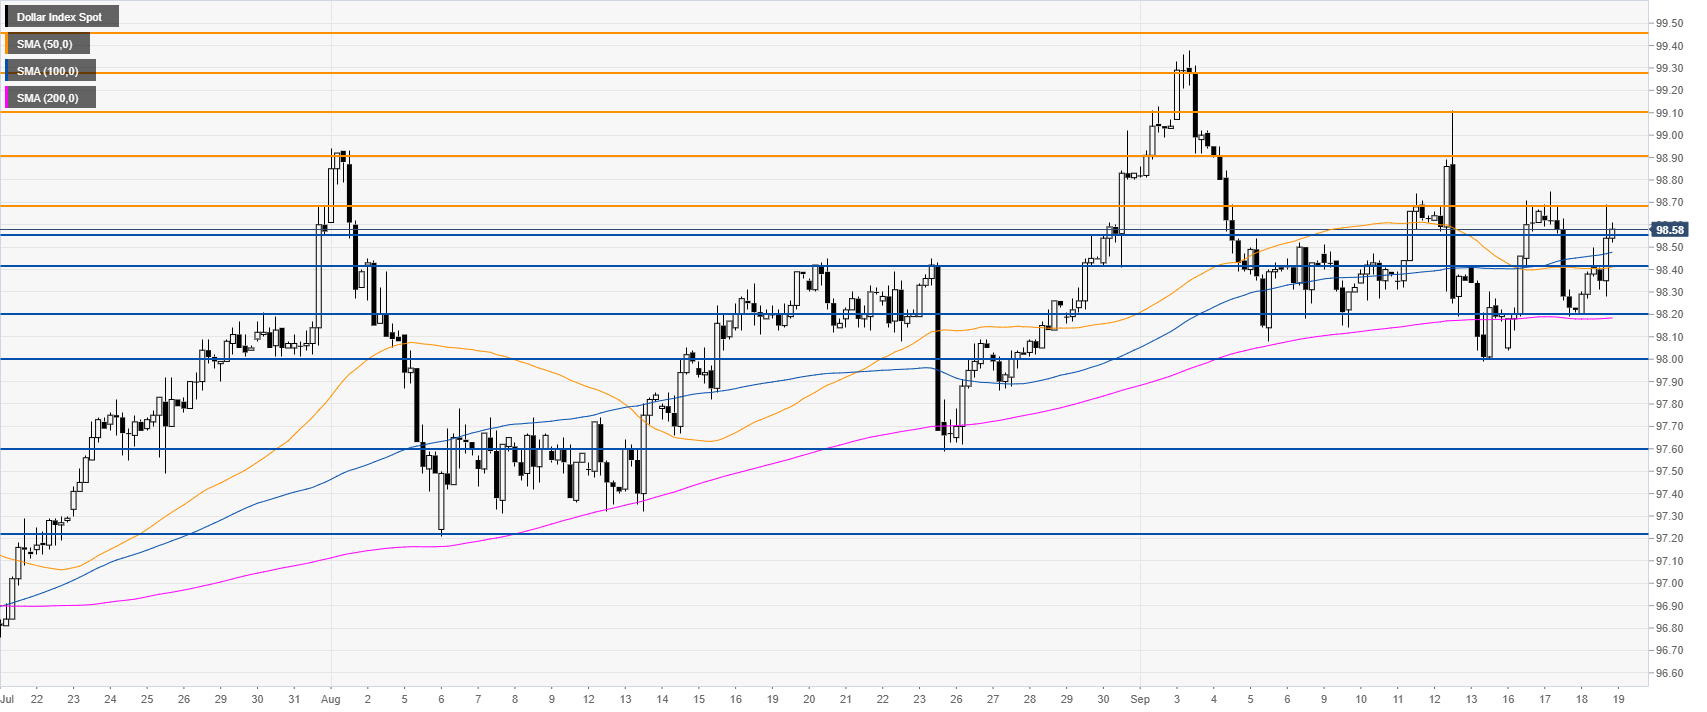
DXY four-hour chart
DXY is trading above the main SMAs, suggesting bullish momentum in the medium term. Bulls will try to pierce the 98.68 resistance to travel north towards 98.90 and 99.10 resistances.
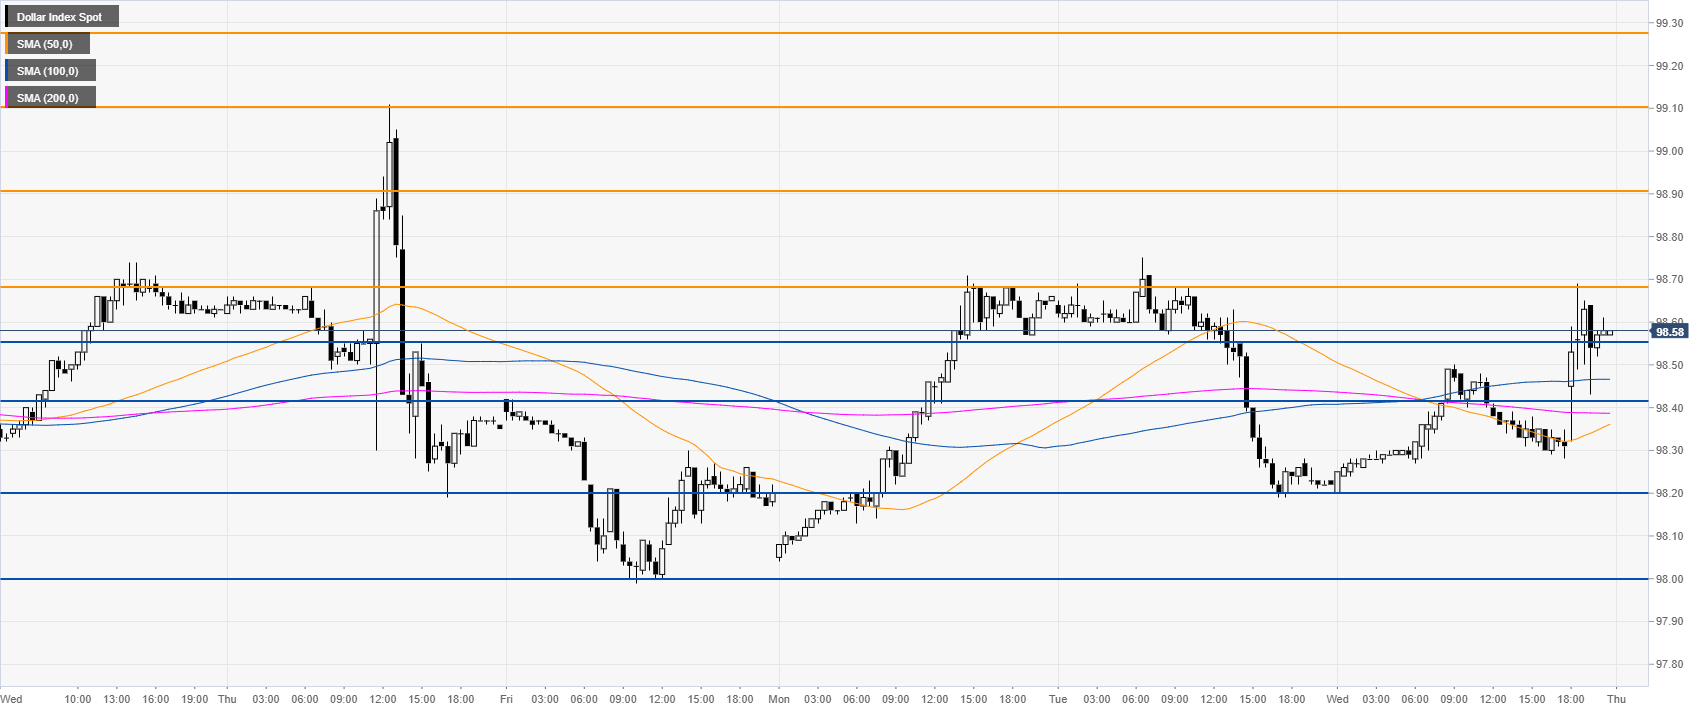
DXY 30-minute chart
DXY is trading above the main SMAs, suggesting a bullish bias in the near term. Immediate support is at the 98.55 and 98.42 price levels.
Additional key levels