Back
26 Apr 2019
EUR/USD Technical Analysis: Euro corrects towards 1.1160 despite better-than-expected US GDP
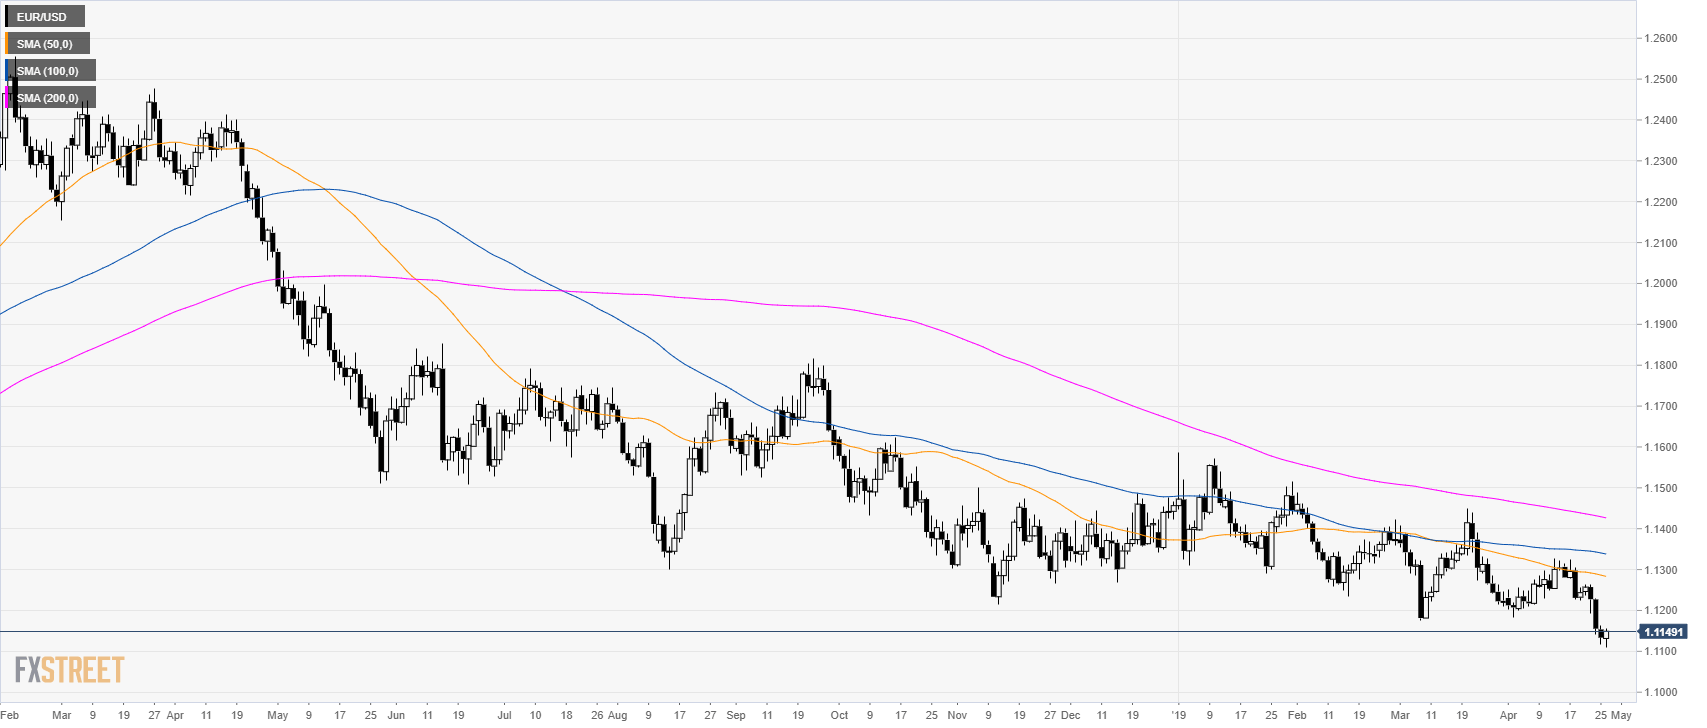
EUR/USD daily chart
- EUR/USD is trading in a bear trend below its main simple moving average (SMAs).
- The US Gross Domestic Product Annualized (GDP) for the first quarter came in at 3.2% vs. 2.1% forecast.
- After an initial reaction down, EUR/USD is now correcting to the upside.
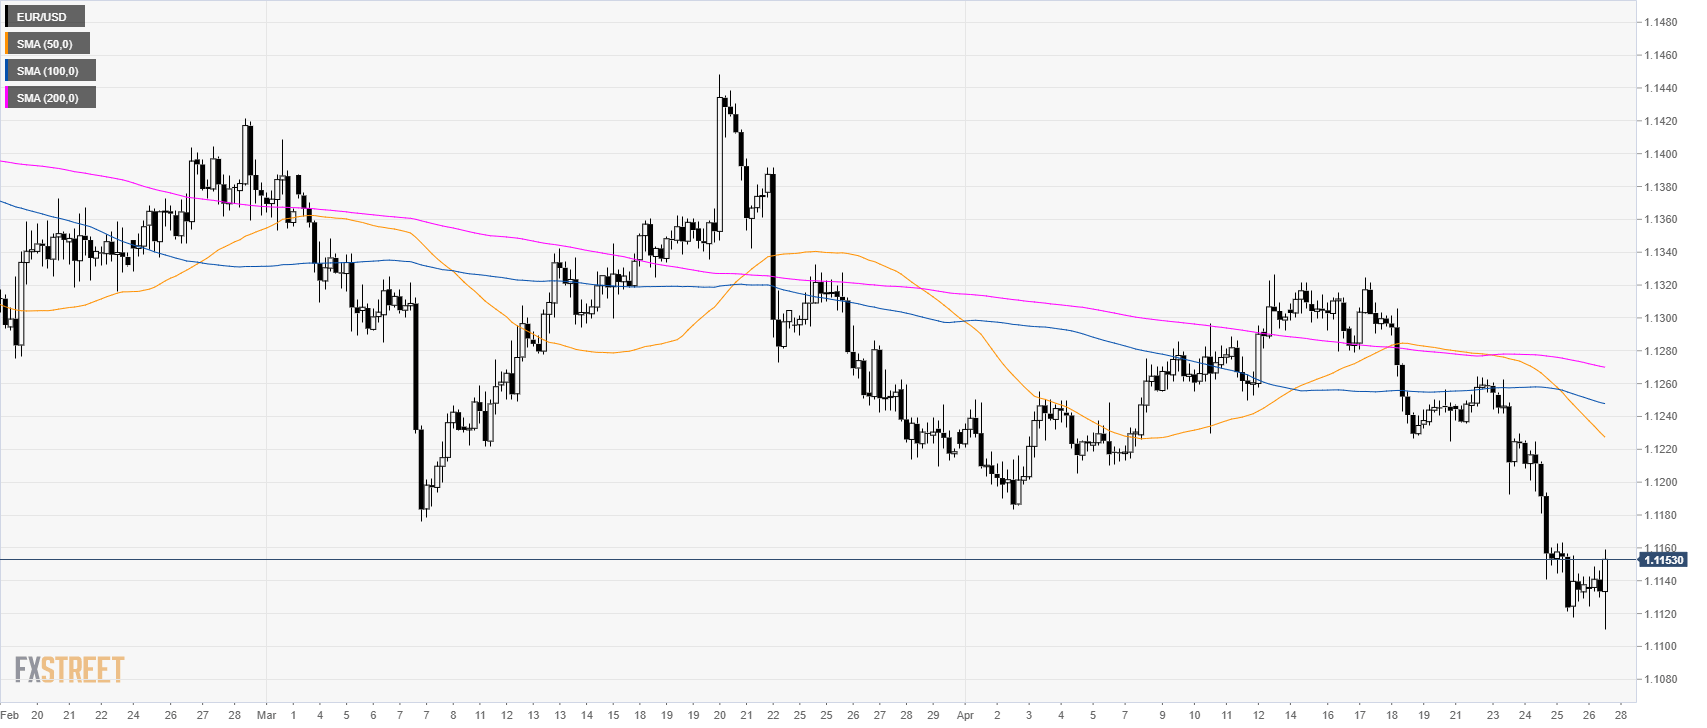
EUR/USD 4-hour chart
- EUR/USD is trading below its main SMAs suggesting a bearish bias in the medium-term.
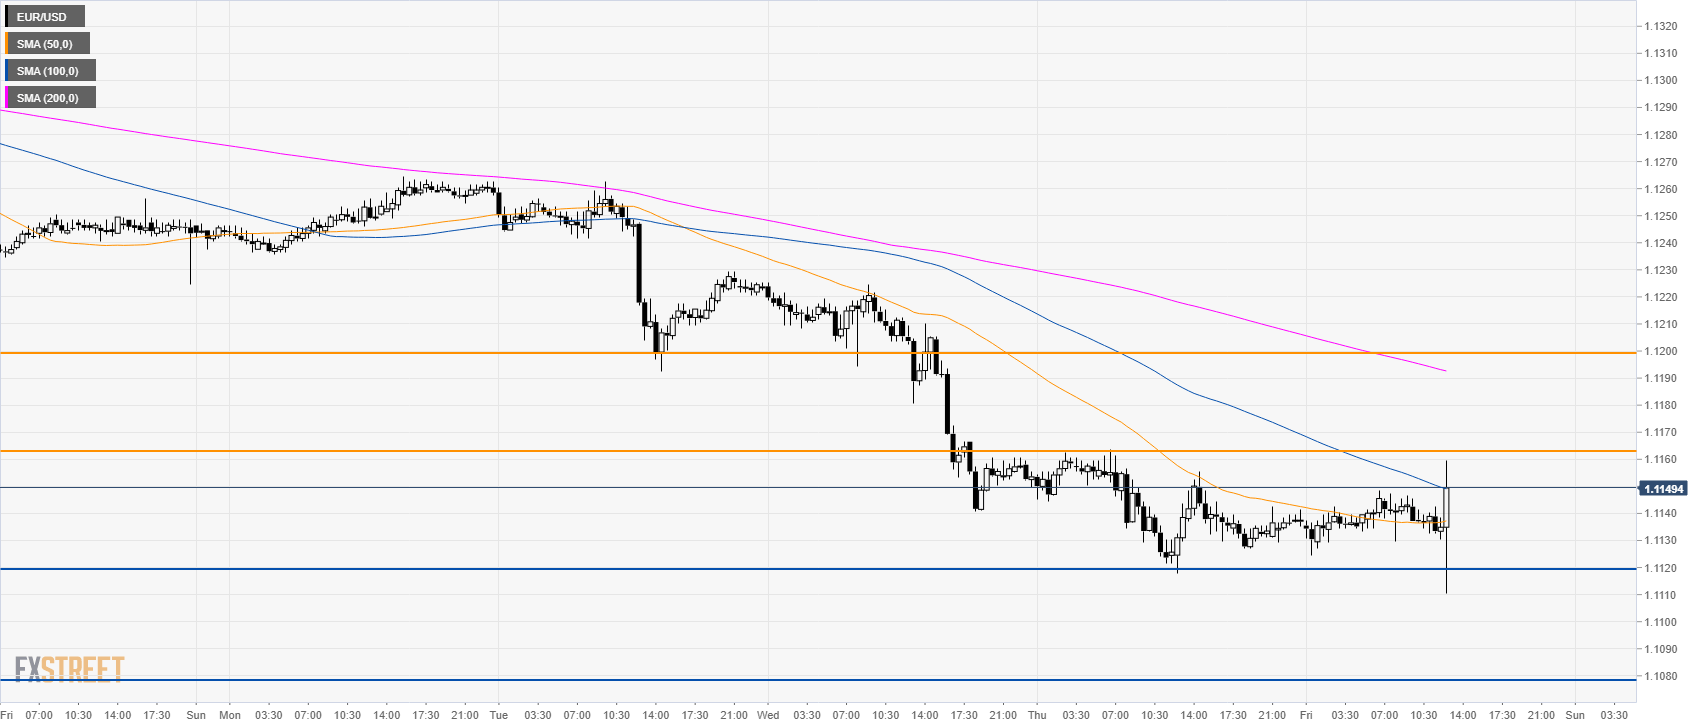
EUR/USD 30-minute chart
- EUR/USD is trading above its 50 and 100 SMAs suggesting a correction up
- Resistances to the upside are seen at 1.1160 and 1.1200 level.
- Support is at 1.1200 and 1.1080 level.
Additional key levels