Oil Technical Analysis: WTI breaks to a new 2019 high reaching $56.22 a barrel
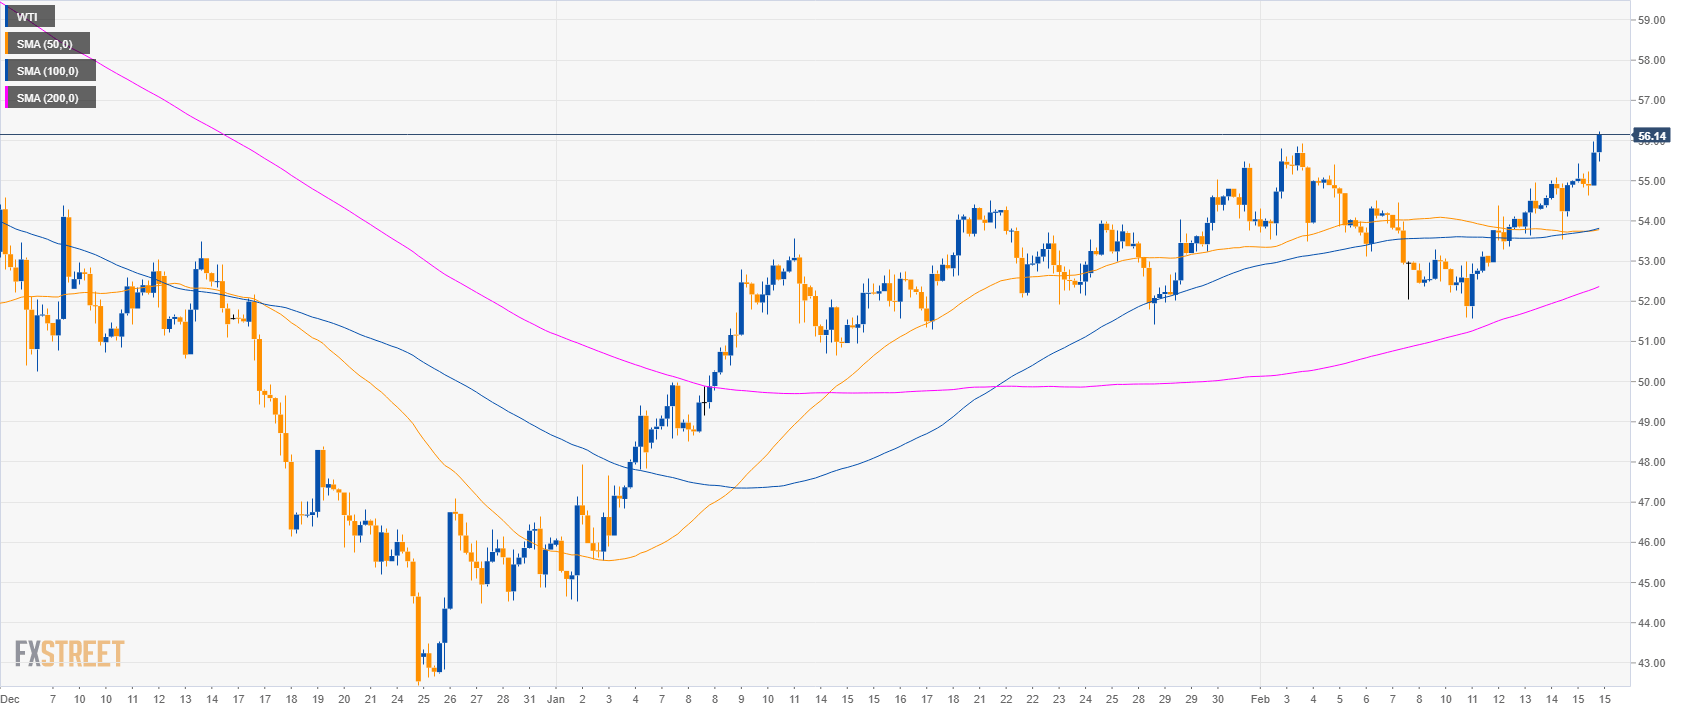
Oil daily chart
- Crude oil WTI is trading in a bear trend below its 200-day simple moving average.
- WTI broke to a new 2019 high this Friday.
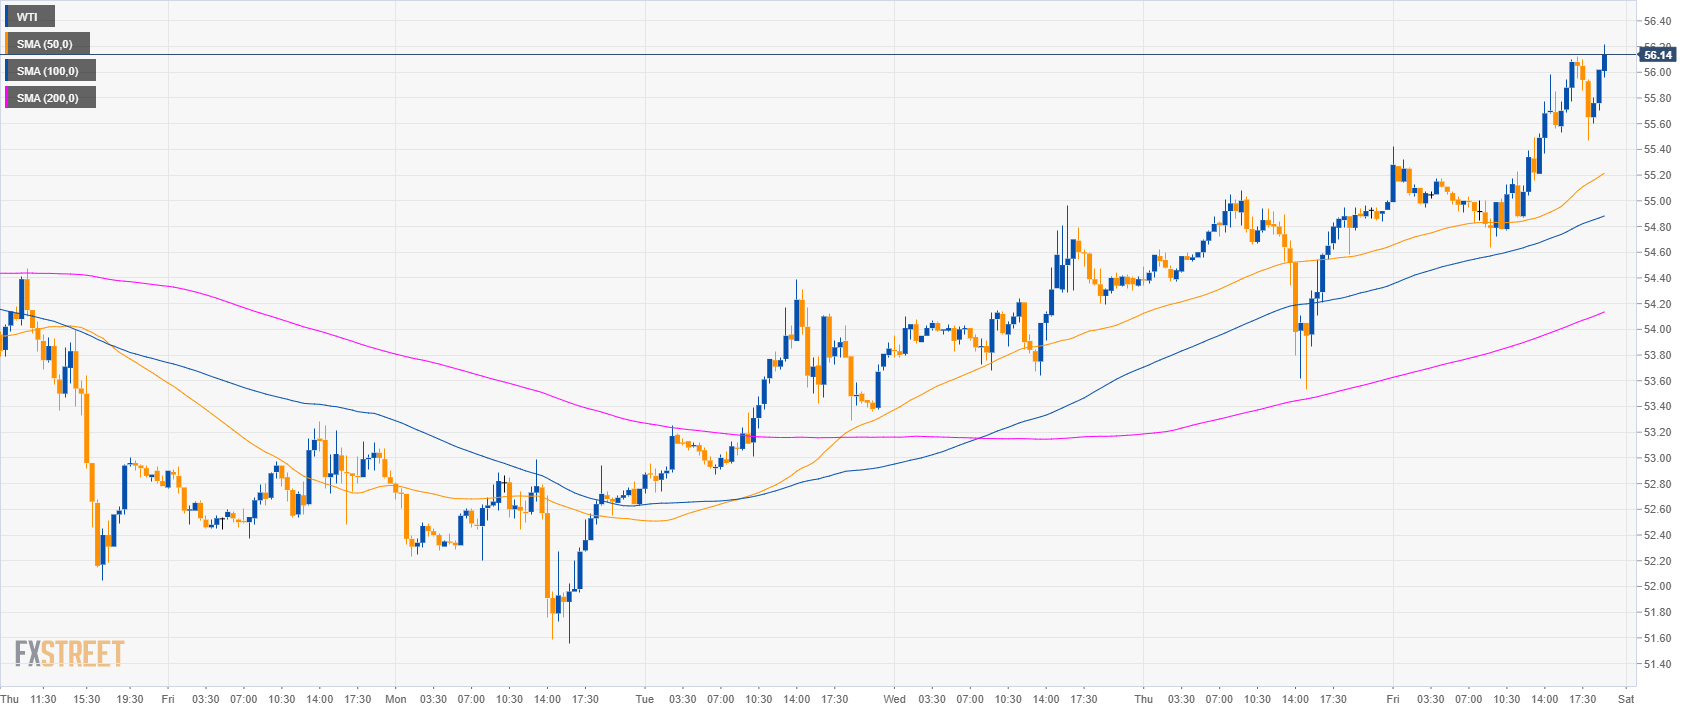
Oil 4-hour chart
- Crude oil is trading between the 100 and 200 SMA suggesting a sideways market in the medium-term.
Oil 30-minute chart
- WTI is trading above its main SMAs suggesting bullish momentum in the short-term.
- The next resistance to the upside are seen at 57.00 and 57.50 level.
- Support is seen at 54.60 and 53.60 level.

Additional key levels
WTI
Overview:
Today Last Price: 56.14
Today Daily change: 128 ticks
Today Daily change %: 2.33%
Today Daily Open: 54.86
Trends:
Daily SMA20: 53.75
Daily SMA50: 51.15
Daily SMA100: 56.06
Daily SMA200: 62.9
Levels:
Previous Daily High: 55.08
Previous Daily Low: 53.53
Previous Weekly High: 55.93
Previous Weekly Low: 52.05
Previous Monthly High: 55.48
Previous Monthly Low: 44.52
Daily Fibonacci 38.2%: 54.49
Daily Fibonacci 61.8%: 54.12
Daily Pivot Point S1: 53.9
Daily Pivot Point S2: 52.94
Daily Pivot Point S3: 52.35
Daily Pivot Point R1: 55.45
Daily Pivot Point R2: 56.04
Daily Pivot Point R3: 57