USD/JPY Technical Analysis: teasing a bull flag breakout
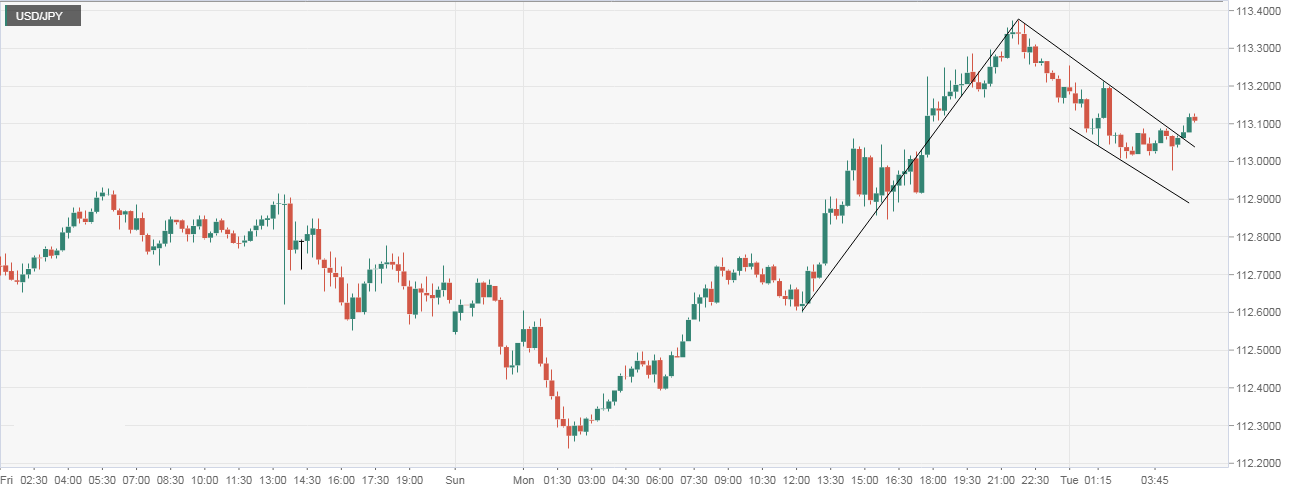
- The bull flag breakout seen in the USD/JPY's 15-minute chart indicates a resumption of the rally from 112.60 and has opened up upside toward 113.85 (target as per the measured height method).
- That only adds to the bullish view put forward by the pair's strong bounce from the crucial 100-day moving average (MA) yesterday. Moreover, the long-term average caught lows on a closing basis in May, August, September, and October.
15-minute chart
Trend: Bullish
USD/JPY
Overview:
Today Last Price: 113.12
Today Daily change: -16 pips
Today Daily change %: -0.141%
Today Daily Open: 113.28
Trends:
Previous Daily SMA20: 113.2
Previous Daily SMA50: 113.04
Previous Daily SMA100: 112.28
Previous Daily SMA200: 110.61
Levels:
Previous Daily High: 113.3
Previous Daily Low: 112.24
Previous Weekly High: 113.83
Previous Weekly Low: 112.23
Previous Monthly High: 114.25
Previous Monthly Low: 112.3
Previous Daily Fibonacci 38.2%: 112.89
Previous Daily Fibonacci 61.8%: 112.64
Previous Daily Pivot Point S1: 112.58
Previous Daily Pivot Point S2: 111.88
Previous Daily Pivot Point S3: 111.53
Previous Daily Pivot Point R1: 113.64
Previous Daily Pivot Point R2: 113.99
Previous Daily Pivot Point R3: 114.69