Back
14 Jun 2018
Crude oil WTI Technical Analysis: Black Gold bulls cling to $67.00 a barrel
- The bears drove oil to the lower trendline from which bulls rebounded from. The market is currently testing the 67.00 level.
- The market is evolving in a bullish channel with a wedge shape.. The next resistance to overcome will be the 67.00 level and the 100-period simple moving average on the 4-hour chart.
- A failure to break above 67.00 could lead to a rotation down as bulls are slowly losing momentum.
Crude oil WTI 15-minute chart
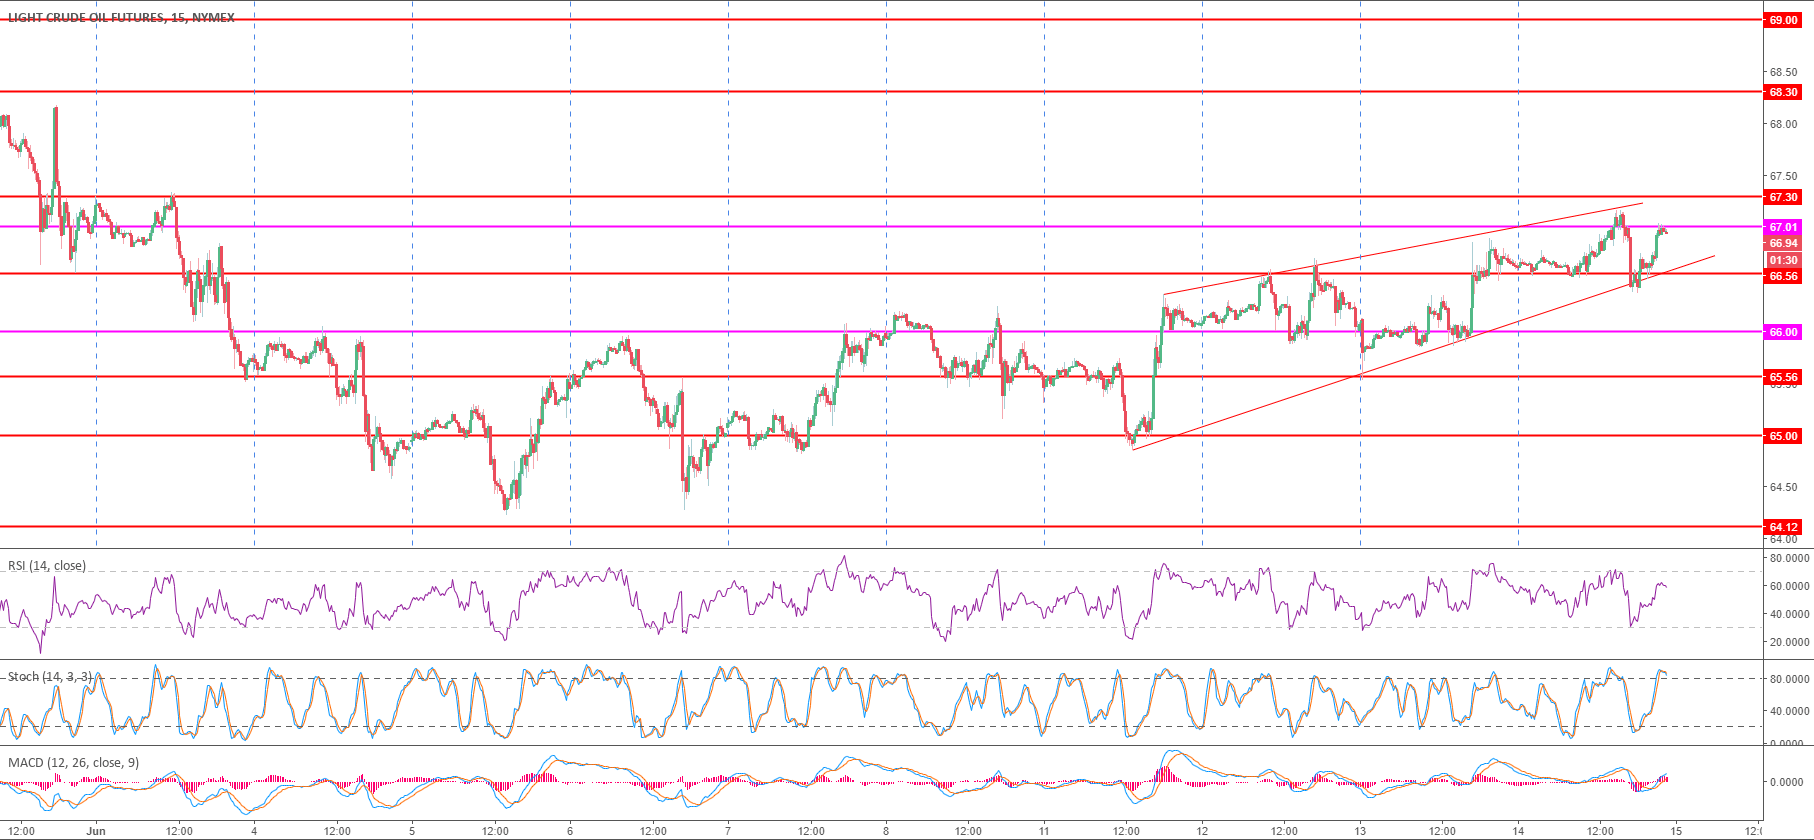
Spot rate: 66.94
Relative change: 0.45%
High: 67.14
Low: 66.33
Trend: Bullish
Resistance 1: 67.00 figure
Resistance 3: 67.30 supply level
Resistance 4: 68.30 May 31 high
Support 1: 66.56 May 31 low
Support 1: 66.00 key support
Support 2: 65.52 June 13 low