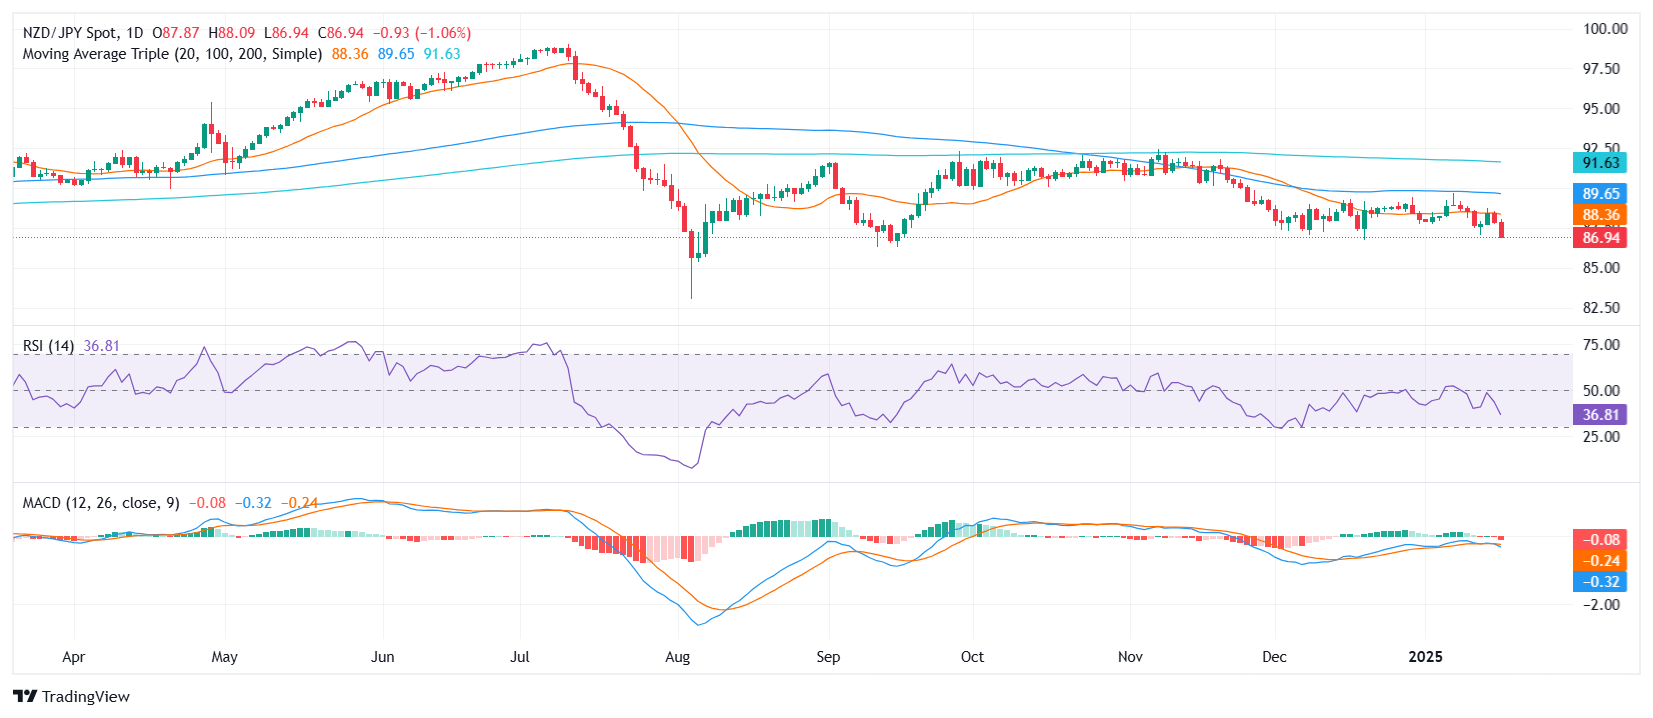
NZD/JPY Price Analysis: Fresh sell-off signals deeper downside potential
- NZD/JPY slipped to around 87.00 in a renewed wave of selling.
- RSI plunges, reinforcing the pair’s tilt toward sustained bearish momentum.
- MACD histogram prints rising red bars, hinting that sellers may remain in control for now.
The NZD/JPY cross found itself under renewed pressure on Thursday, sliding 0.84% to around 87.05. Persistent selling has kept the pair pinned to lower levels, erasing gains from earlier this week. The swift downside move suggests that market participants remain inclined to sell on any short-lived rebounds, effectively tilting the near-term tone toward negativity.
In terms of technical indicators, the Relative Strength Index (RSI) has declined sharply to 37, emphasizing building downside momentum. Meanwhile, the Moving Average Convergence Divergence (MACD) histogram shows rising red bars, underscoring that sellers are retaining their grip. Combined, these signals point to a cautious backdrop where buyers may hesitate to reenter aggressively.
Looking ahead, immediate support appears near the 86.80–87.00 region, with a break below this zone potentially opening the door toward 86.50 or lower. On the flip side, if bulls manage to drive NZD/JPY above the 87.70 pivot, it could spark a modest recovery, though the overall bias would likely stay negative unless the pair can reclaim the 88.00 handle with conviction.
NZD/JPY daily chart

