Dow Jones Industrial Average recovers footing on Thursday
- The Dow Jones rose 450 points on Thursday as sentiment recovered.
- US GDP figures bolstered investor confidence after printing above expectations.
- US PCE inflation numbers still loom ahead on Friday.
The Dow Jones Industrial Average (DJIA) rose 1.1%, or 450 points, on Thursday, buoyed by a forecast beat in US Gross Domestic Product (GDP) growth numbers in Q2. US Personal Consumption Expenditure Price Index (PCE) inflation data, due on Friday, is still the key print of the week. Markets remain confident that the Federal Reserve (Fed) is on pace to kick off a rate-cutting cycle in September.
US Q2 GDP beat forecasts Thursday morning, propping up market sentiment and sending investors back into a bidding stance. Annualized Q2 GDP came in at 3.0% compared to the expected hold at 2.8%, and Initial Jobless Claims also ticked down to 231K for the week ended August 23. Investors had expected a print of 232K compared to the previous week’s revised 233K.
US core PCE inflation on Friday is expected to hold steady MoM and drift slightly higher on an annualized basis. July’s MoM core PCE inflation is forecast to hold at 0.2%, while the YoY figure for July is expected to tick up to 2.7% from the previous 2.6%. A below-expectations print will send markets piling back into hopes for an extended initial cut from the Fed on September 18, while an above-forecast release could send traders scurrying in the face of a potential resurgence in inflation, hobbling the Fed just before a widely-expected cut.
Dow Jones news
A risk-on Thursday has most of the Dow Jones index trading into the green in the back half of the trading week. Only one of the Dow’s listed securities are in the red for the day, with Home Depot (HD) shedding around one-fifth of one percent to trade below $370.00 per share.
Nvidia’s (NVDA) after-hours earnings call this week failed to jump-start tech-keen investors. Nvidia reported less-than-expected growth in earnings, with an overall uptick in profit failing to meet sky-high expectations set by runaway investors.
Dow Jones price forecast
The Dow Jones is back over 41,300 on Thursday after a brief midweek dip below the 41,000 handle. The index took a breather on Wednesday, but it has tilted back into the bullish side as daily candles continue to test chart paper near record highs set at the beginning of the trading week.
Traders hoping to capitalize on a bearish pullback run the risk of underestimating bullish market pressure, but risk-takers will be looking for signs of a technical breakdown to jump on the short train. Immediate technical targets are floating near the 50-day Exponential Moving Average (EMA) just above the 40,000 major price handle.
Dow Jones daily chart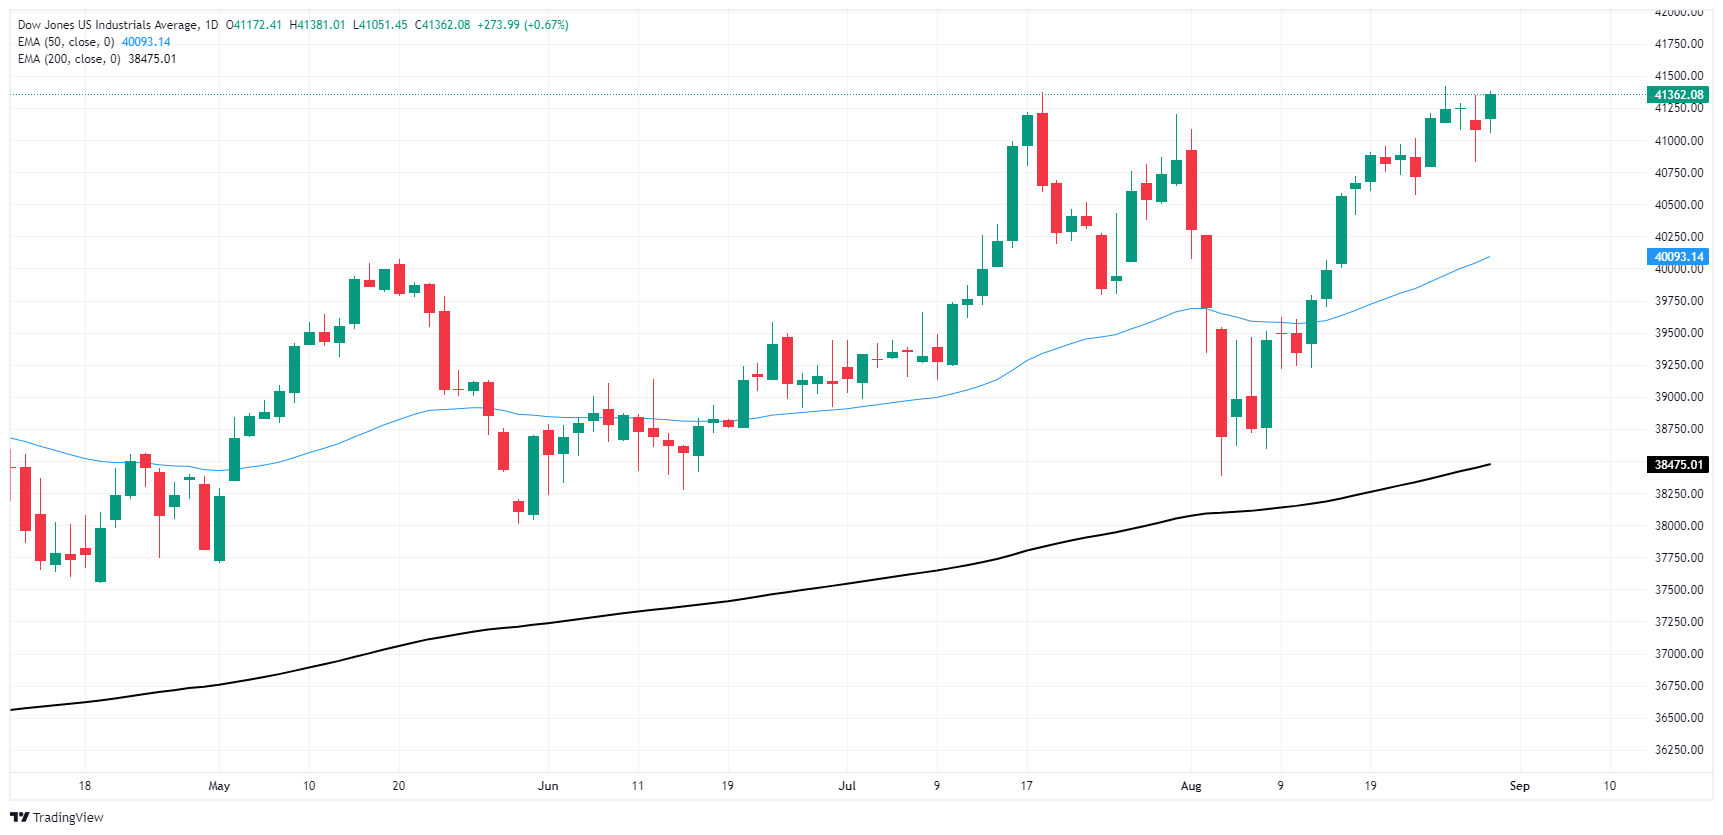
Dow Jones FAQs
The Dow Jones Industrial Average, one of the oldest stock market indices in the world, is compiled of the 30 most traded stocks in the US. The index is price-weighted rather than weighted by capitalization. It is calculated by summing the prices of the constituent stocks and dividing them by a factor, currently 0.152. The index was founded by Charles Dow, who also founded the Wall Street Journal. In later years it has been criticized for not being broadly representative enough because it only tracks 30 conglomerates, unlike broader indices such as the S&P 500.
Many different factors drive the Dow Jones Industrial Average (DJIA). The aggregate performance of the component companies revealed in quarterly company earnings reports is the main one. US and global macroeconomic data also contributes as it impacts on investor sentiment. The level of interest rates, set by the Federal Reserve (Fed), also influences the DJIA as it affects the cost of credit, on which many corporations are heavily reliant. Therefore, inflation can be a major driver as well as other metrics which impact the Fed decisions.
Dow Theory is a method for identifying the primary trend of the stock market developed by Charles Dow. A key step is to compare the direction of the Dow Jones Industrial Average (DJIA) and the Dow Jones Transportation Average (DJTA) and only follow trends where both are moving in the same direction. Volume is a confirmatory criteria. The theory uses elements of peak and trough analysis. Dow’s theory posits three trend phases: accumulation, when smart money starts buying or selling; public participation, when the wider public joins in; and distribution, when the smart money exits.
There are a number of ways to trade the DJIA. One is to use ETFs which allow investors to trade the DJIA as a single security, rather than having to buy shares in all 30 constituent companies. A leading example is the SPDR Dow Jones Industrial Average ETF (DIA). DJIA futures contracts enable traders to speculate on the future value of the index and Options provide the right, but not the obligation, to buy or sell the index at a predetermined price in the future. Mutual funds enable investors to buy a share of a diversified portfolio of DJIA stocks thus providing exposure to the overall index.