确认您不是来自美国或菲律宾

在此声明,本人明确声明并确认:
  • 我不是美国公民或居民
  • 我不是菲律宾居民
  • 本人没有直接或间接拥有美国居民10%以上的股份/投票权/权益,和/或没有通过其他方式控制美国公民或居民。
  • 本人没有直接或间接的美国公民或居民10%以上的股份/投票权/权益的所有权,和/或受美国公民或居民其他任何方式行使的控制。
  • 根据FATCA 1504(a)对附属关系的定义,本人与美国公民或居民没有任何附属关系。
  • 我知道做出虚假声明所需付的责任。
就本声明而言,所有美国附属国家和地区均等同于美国的主要领土。本人承诺保护Octa Markets Incorporated及其董事和高级职员免受因违反本声明而产生或与之相关的任何索赔。
我们致力于保护您的隐私和您个人信息的安全。我们只收集电子邮件,以提供有关我们产品和服务的特别优惠和重要信息。通过提交您的电子邮件地址,您同意接收我们的此类信件。如果您想取消订阅或有任何问题或疑虑,请联系我们的客户支持。
Octa trading broker
开通交易账户
Test
Back

GBP/USD Price Analysis: Remains bearish, falls below 1.2700

  • GBP/USD trades below 1.2700 after hitting a two-day high of 1.2720.
  • Resistance at a broken support trendline could lead to further price drops.
  • Key support levels: 1.2656 (June 14 low) and 1.2643/34 (100-DMA confluence and May 3 high).

The Pound Sterling creeps lower against the US Dollar on Tuesday, amid a scarce economic docket in the UK following the release of mixed data in the United States. At the time of writing, the GBP/USD trades at 1.2688, down 0.12%.

GBP/USD Price Analysis: Technical outlook

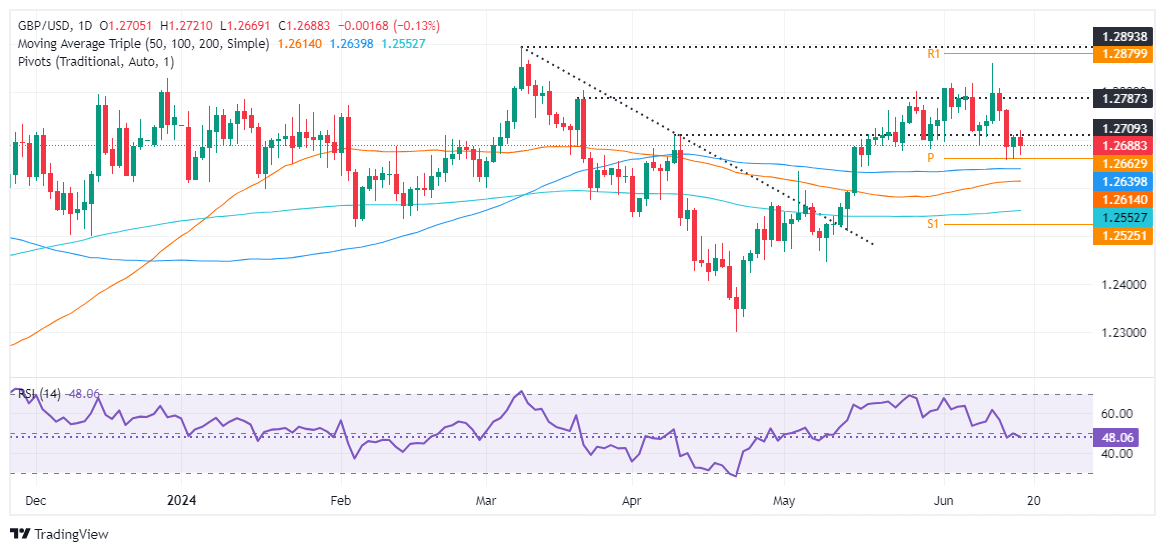
Following a dip to a multi-week low of 1.2656, the GBP/USD has shown signs of resilience, managing to regain some ground. However, it's important to note that it still hovers below a one-month broken support trendline turned resistance, which could potentially lead to further price drops.

Momentum shows that sellers remained unchanged, as revealed by the Relative Strength Index (RSI).

If GBP/USD drops below 1.2700, the exchange rate will continue to fall and face the first support, at 1.2656, the June 14 low. Once cleared, the next stop would be the 100-day moving average (DMA) confluence and the May 3 high at 1.2643/34, ahead of 1.2600.

Conversely, if GBP/USD climbs past 1.2720/30, that could exacerbate a rally toward 1.2800.

GBP/USD Price Action – Daily Chart

GBP/USD

Overview
Today last price 1.2689
Today Daily Change -0.0016
Today Daily Change % -0.13
Today daily open 1.2705
 
Trends
Daily SMA20 1.2743
Daily SMA50 1.2614
Daily SMA100 1.264
Daily SMA200 1.2552
 
Levels
Previous Daily High 1.271
Previous Daily Low 1.2659
Previous Weekly High 1.286
Previous Weekly Low 1.2657
Previous Monthly High 1.2801
Previous Monthly Low 1.2446
Daily Fibonacci 38.2% 1.269
Daily Fibonacci 61.8% 1.2678
Daily Pivot Point S1 1.2673
Daily Pivot Point S2 1.2641
Daily Pivot Point S3 1.2622
Daily Pivot Point R1 1.2723
Daily Pivot Point R2 1.2742
Daily Pivot Point R3 1.2774


Oil feels good as bulls take the wheel – TDS

Crude Oil continues to prove resilient, with upside momentum firming and Commodity Trading Advisors (CTAs) remaining on the bid, TDS commodity strategists say.
了解更多 Previous

New Zealand GDT Price Index dipped from previous 1.7% to -0.5%

New Zealand GDT Price Index dipped from previous 1.7% to -0.5%
了解更多 Next