EUR/JPY Price Analysis: Snaps a four-day losing streak above 160.00
- EUR/JPY recovers some lost ground near 160.20 on the softer Japanese inflation data.
- The bullish outlook of the cross remains intact above the key Exponential Moving Averages (EMA).
- The key resistance level is seen at 161.00; the 159.90-160.00 zone is the crucial support level.
The EUR/JPY cross snaps a four-day losing streak during the early European trading hours on Friday. The rebound of the cross is supported by weaker-than-expected Japanese CPI inflation data. At press time, the cross currently trades around 160.20, gaining 0.05% on the day.
Early Friday, the headline Tokyo Consumer Price Index (CPI) eased to 1.6% YoY in January from 2.4% in the previous reading. Meanwhile, the Tokyo CPI ex Fresh Food, Energy came in at 3.1% YoY from 3.5% in December. Finally, the CPI figure ex Fresh Food eased to 1.6% YoY from 2.1% in the previous reading, below the expectation of 1.9%.
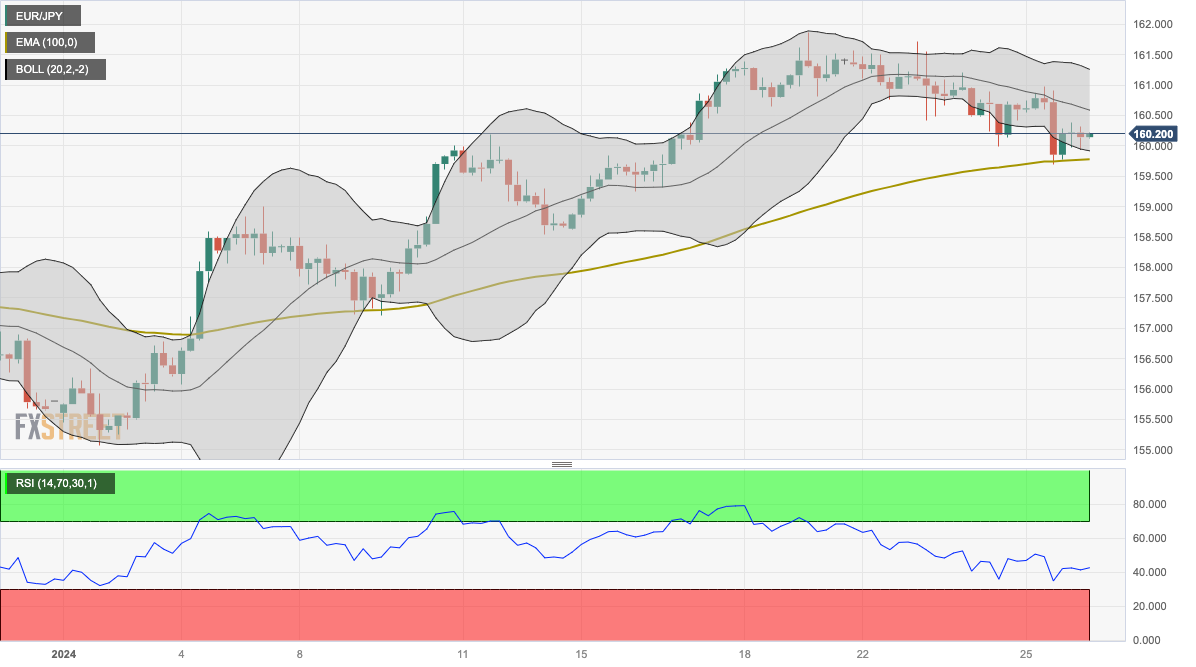
Technically, EUR/JPY keeps the bullish vibe unchanged as the cross holds above the 100-period Exponential Moving Averages (EMA) on the four-hour chart. However, the Relative Strength Index (RSI) stands in bearish territory below the 50-midline, suggesting the sellers look to retain control in the near term.
The confluence of a psychological round mark and a high of January 25 at 161.00 will be the key resistance level for the cross. The next hurdle is seen at the upper boundary of the Bollinger Band at 161.25. A decisive break above the latter will see a rally to a high of January 23 at 161.70, en route to a high of January 19 at 161.87.
On the downside, the crucial support level for the cross will emerge at the 159.90-160.00 region, portraying the lower limit of the Bollinger Band, a low of January 24 and a psychological mark. Any follow-through selling below the mentioned level will see a drop to the 100-period EMA at 159.77. The additional downside filter to watch is a low of January 16 at 159.24, followed by a low of January 12 at 158.54.
EUR/JPY four-hour chart