EUR/GBP Price Analysis: Hovers around 0.8540s, as a double bottom loom
- The EUR/GBP pair shows signs of stabilization in the 0.8540s region after falling to a weekly low.
- Technical patterns suggest a possible double-bottom formation, hinting at a potential upside if confirmed by further price action.
- A break below year-to-date lows could push the EUR/GBP toward the 0.8500 mark, whereas surpassing 0.8555 could open doors for a rally to the 20-day EMA at 0.8584.
In a volatile trading session, EUR/GBP hovers around the 0.8540s area, which witnessed the cross pair falling to a weekly low of 0.8521 but later recovering toward 0.8560 before settling around current exchange rates. As of writing, the EUR/GBP exchanges hands at 0.8548, gains 0.06%.
EUR/GBP Price Analysis: Technical outlook
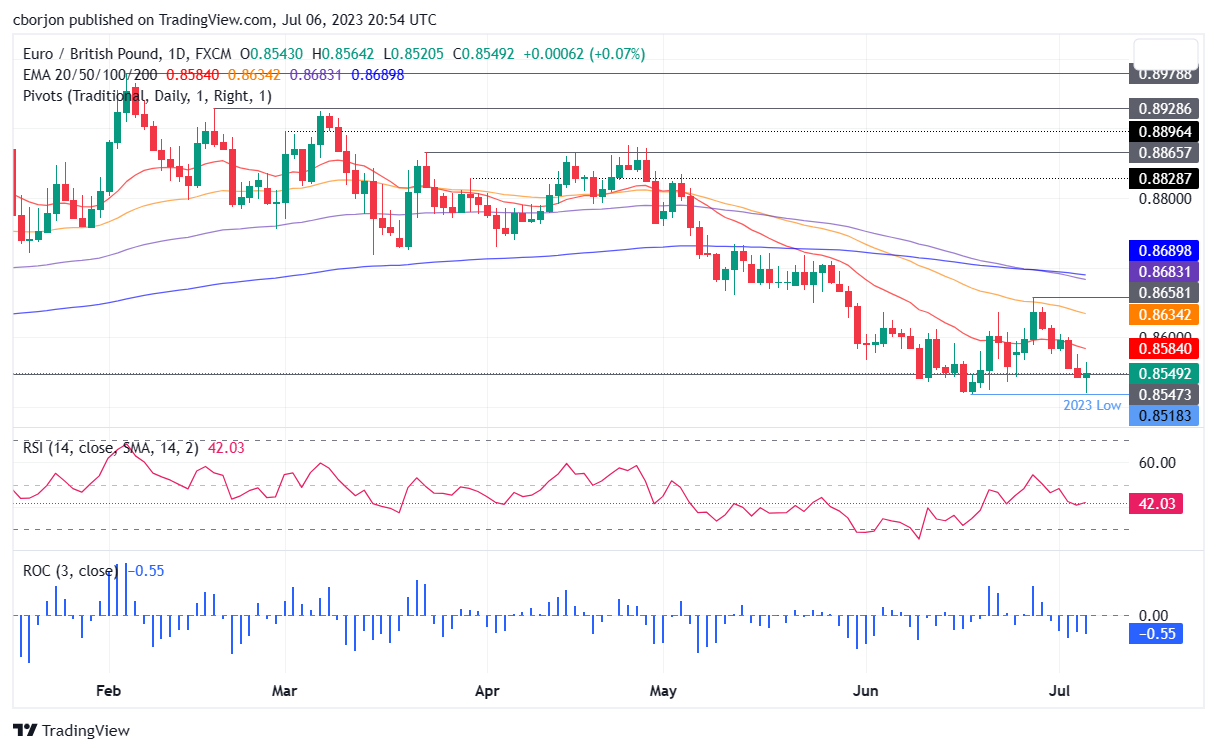
The EUR/GBP is neutral to downward bias, with the exchange rate below the daily Exponential Moving Averages (EMAs). After the EUR/GBP dropped below the 20-day Exponential Moving Average (EMA), it exacerbated a fall to test the year-to-date (YTD) low of 0.8520, but later, the EUR/GBP stabilized at around 0.8540s.
Of note, the EUR/GBP’s daily chart portrays a double bottom formation, but it would need a daily close above the July 5 open of 0.8555 to pave the way for further upside. Additionally, the price action of the last two days would form a bullish engulfing candle pattern.
In that outcome, the EUR/GBP first resistance would be the 20-day EMA at 0.8584. A breach of the latter will expose the 0.8600 figure, followed by the 50-day EMA at 0.8634, before testing the June 28 daily high of 0.8658.
Conversely, the EUR/GBP would extend its losses if it cracks to new year-to-date (YTD) lows, past the current 0.8518, exposing the 0.8500 figure for a test.
EUR/GBP Price Action – Daily chart