
提供最佳价差和条件
 关于平台
关于平台

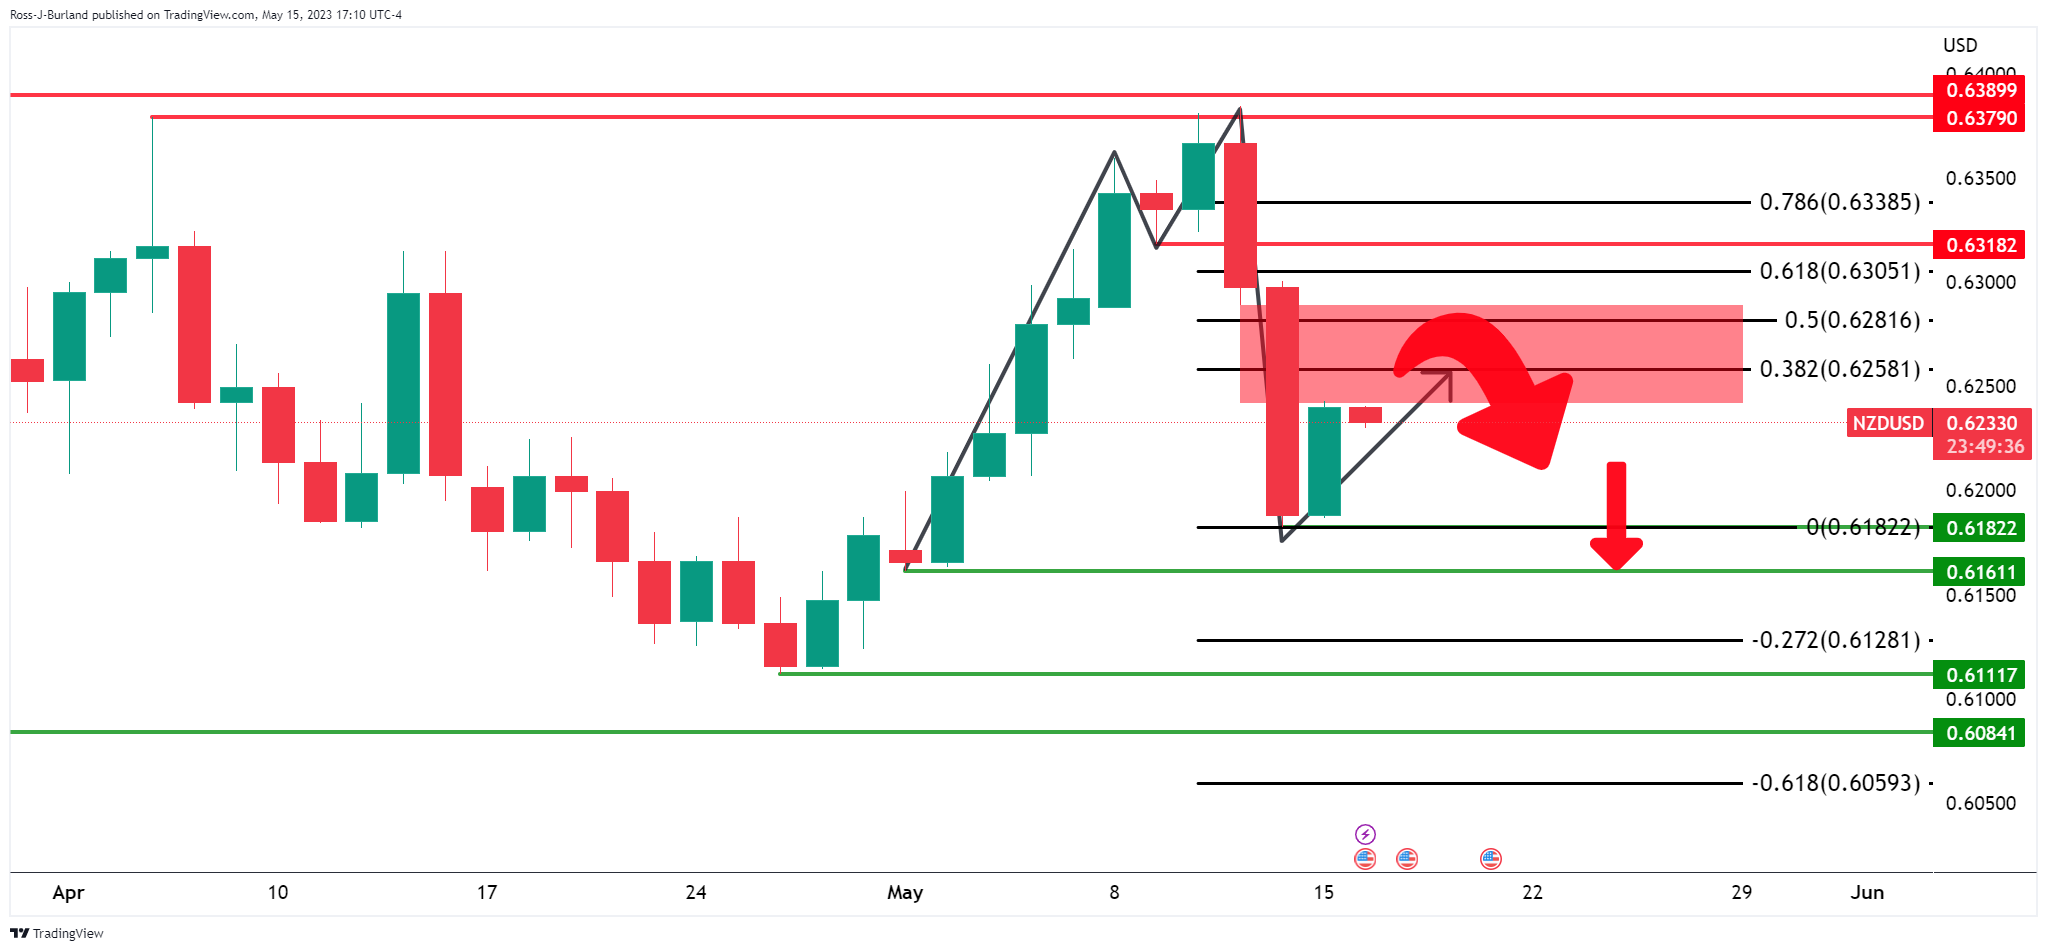
As per the prior analysis from earlier this week, NZD/USD bulls in the market and eye a firm correction, the pair moved up into the 38.2% Fibonacci resistance and came close to a 50% mean reversion before starting to melt to the downside:
Prior analysis:
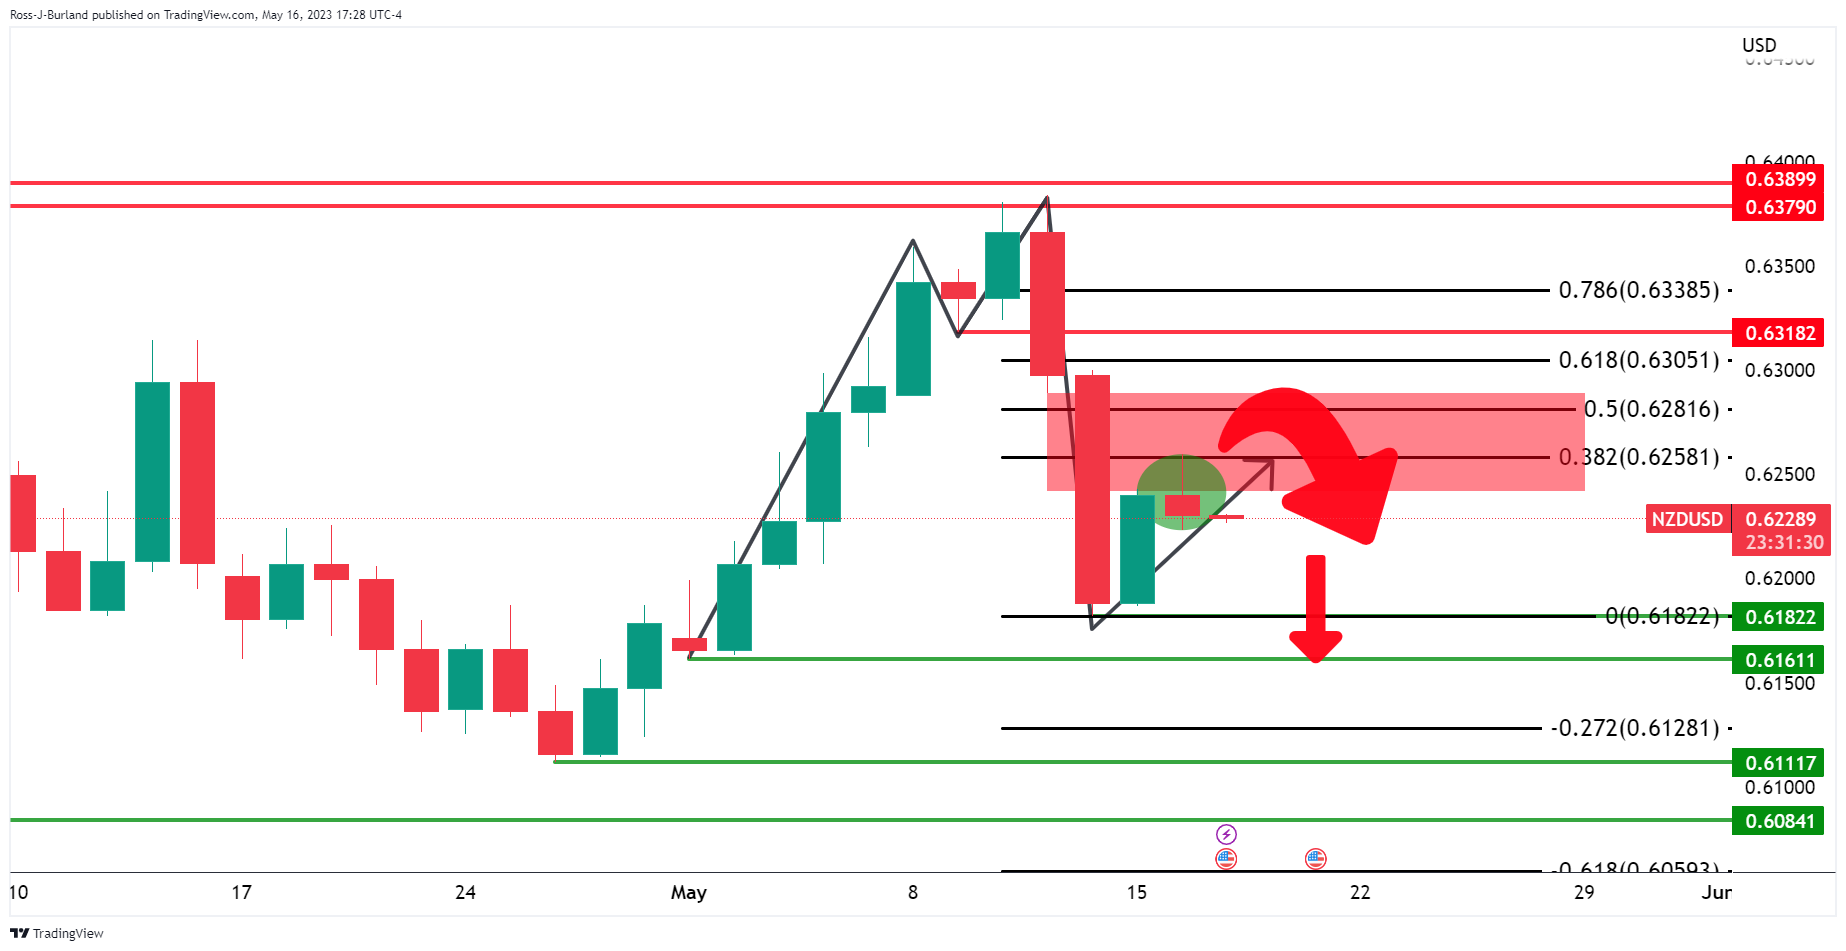
Update 1:
Update 2
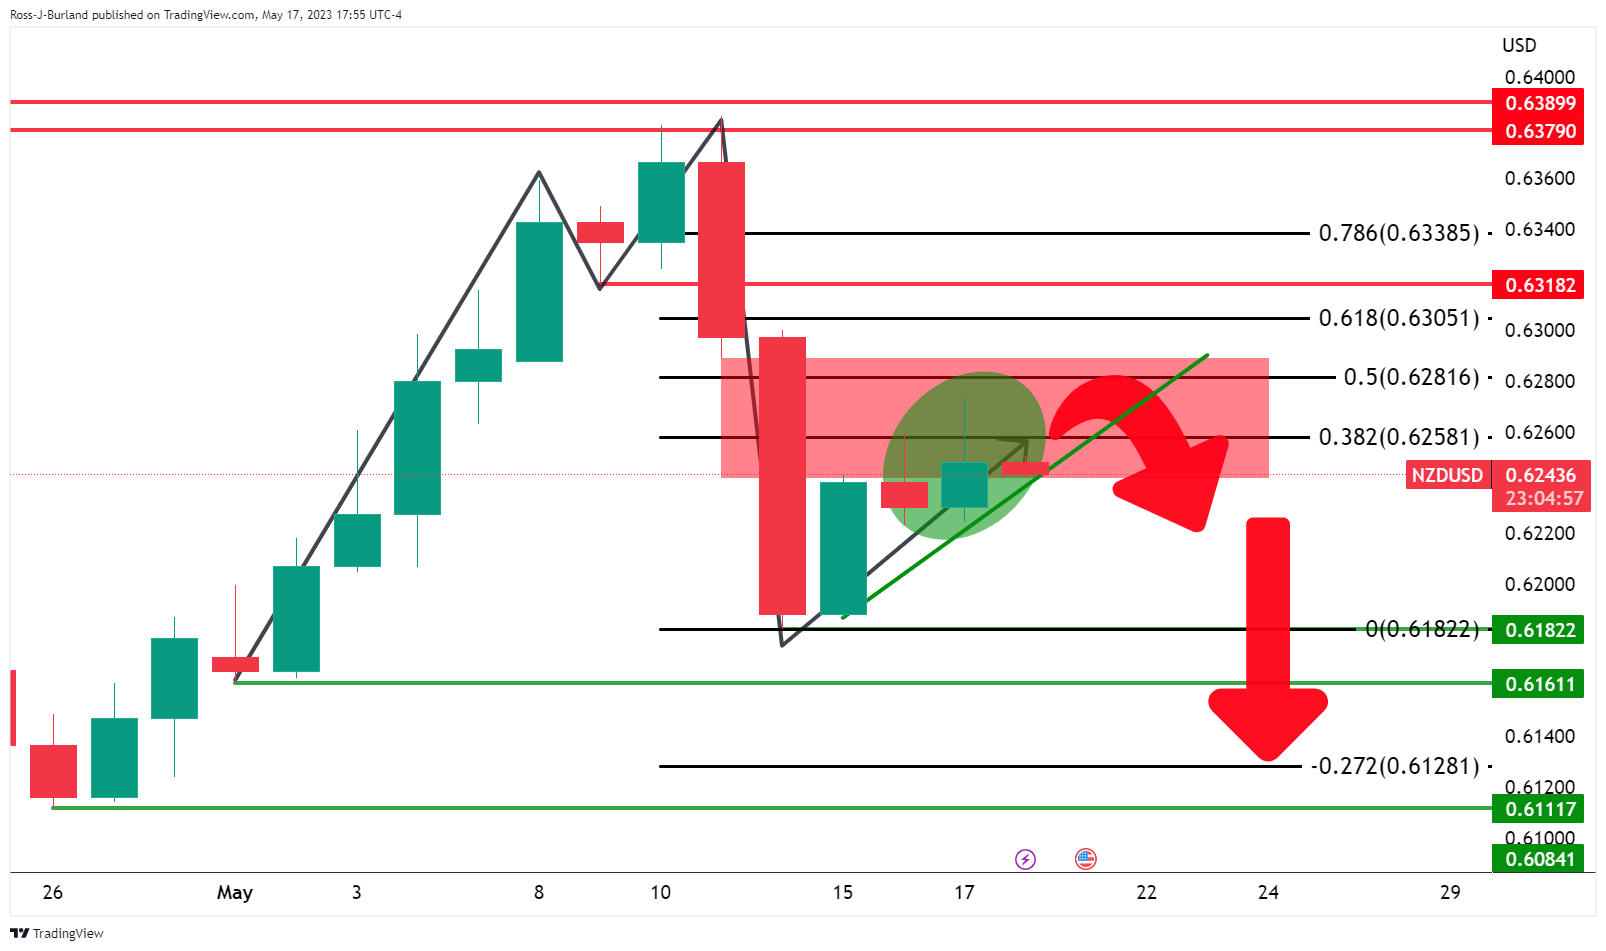
There are still prospects of a move lower although the 4-hour and 1-hour charts can be used to gauge as to whether there is going to be a deceleration in the bullish correction and so far, it is early days still. After all, the price is still on the front side of the bullish dynamic trendline support.
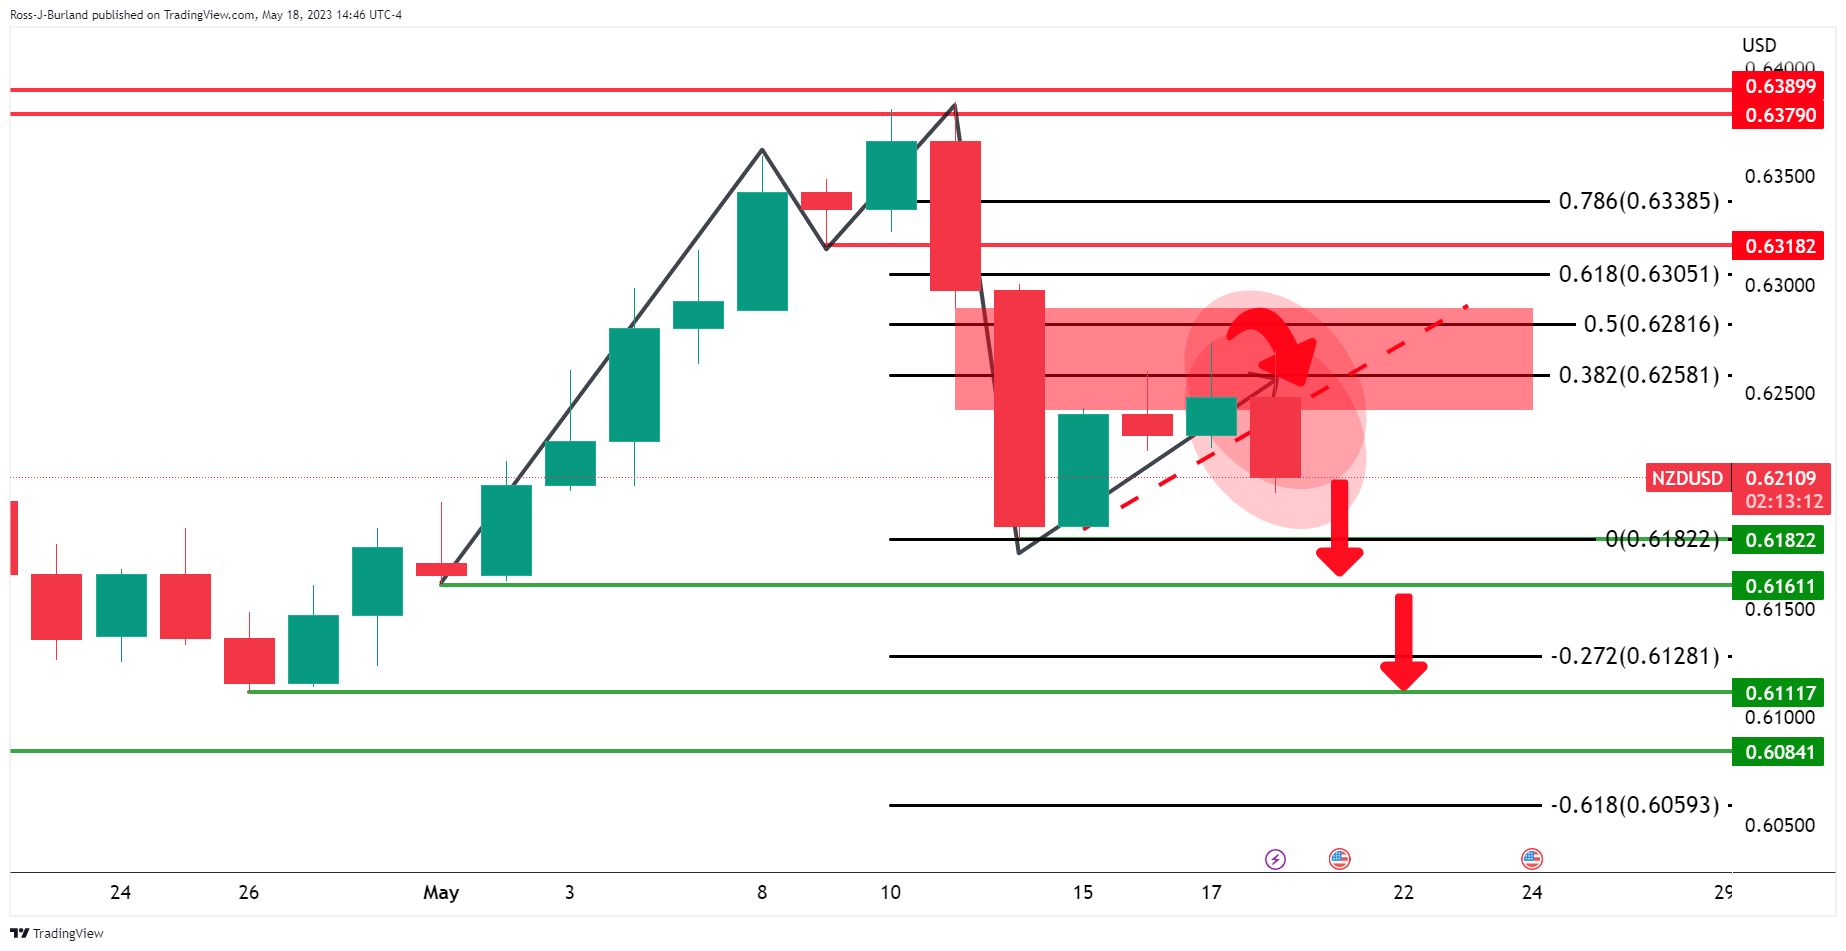
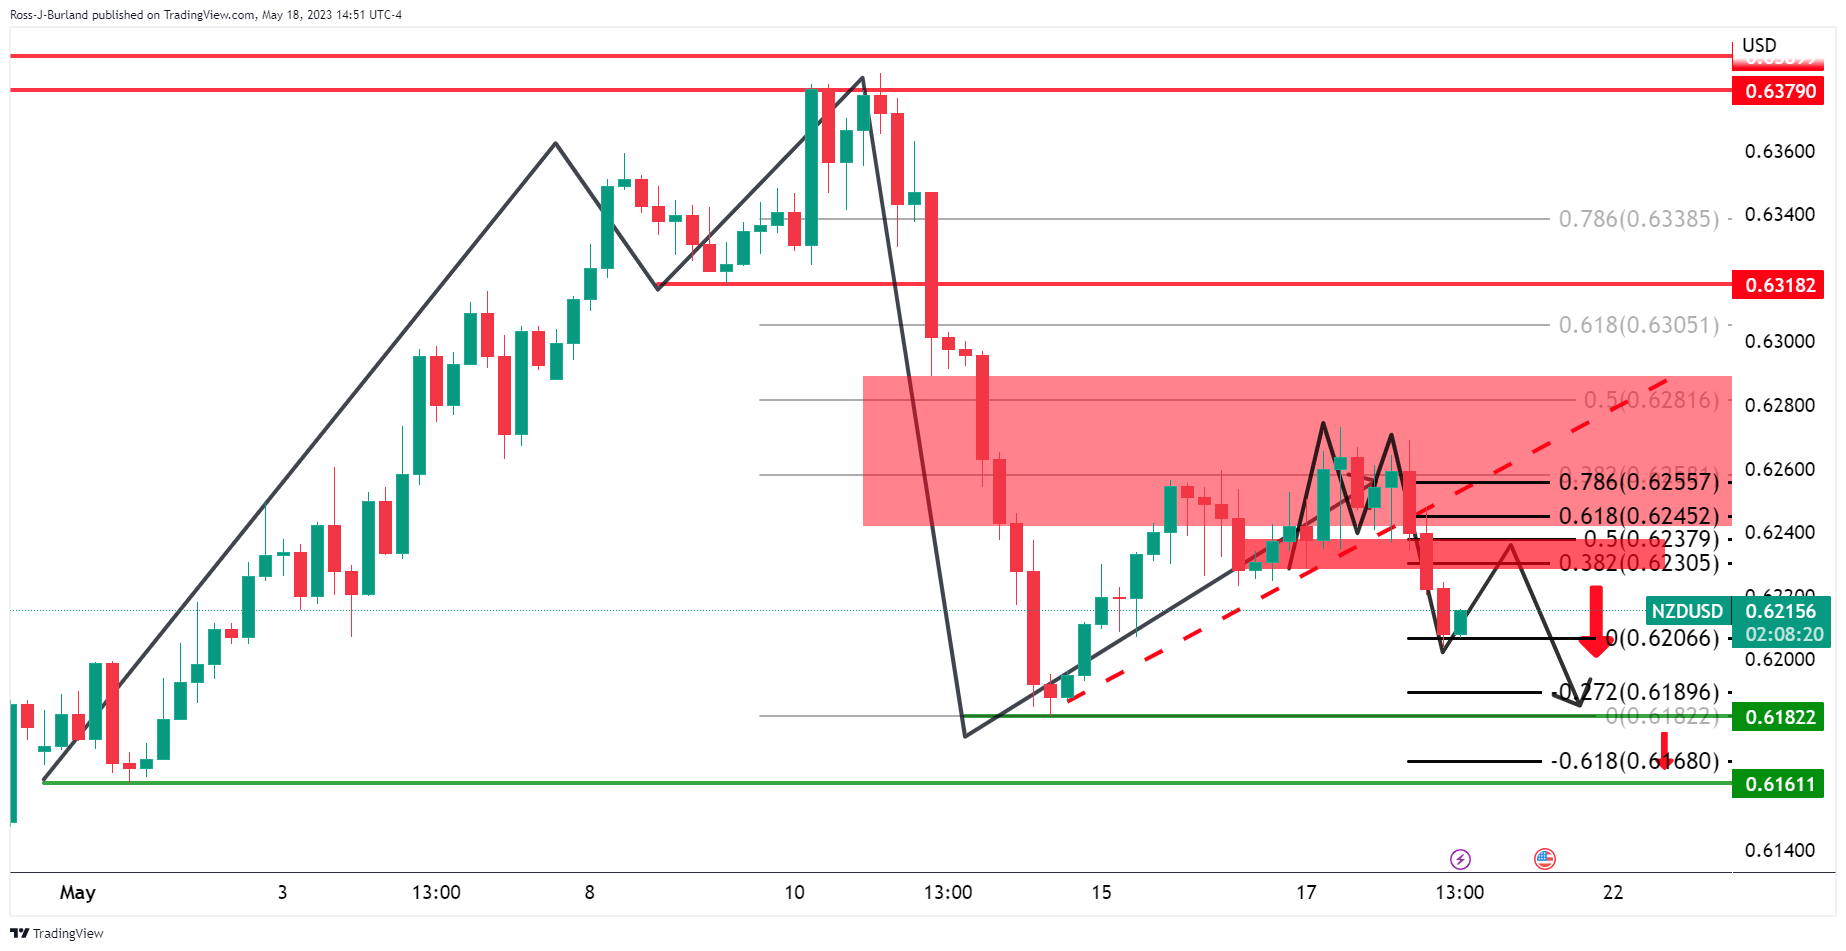
NZD/USD has fallen below the trendline support which now turns to the counter trendline. The M-formation is a compelling feature on the chart as it is a reversion pattern. A pullback could be an opportunity for the bears to sell at a premium in the pursuit of lower grounds longer-term.


