EUR/USD Price Analysis: Extends recovery above 1.1030 ahead of key Eurozone data
- EUR/USD is marching north after a solid recovery from 1.1000 ahead of the Eurozone GDP and German HICP.
- The USD Index has slipped as investors are worried that an increase in the debt-ceiling will impact long-term rating of the US economy.
- EUR/USD is auctioning in an Ascending Triangle pattern, which indicates a volatility contraction.
The EUR/USD pair has stretched its recovery above 1.1030 in the Asian session. Earlier, the major currency pair sensed a significant buying interest from the psychological support of 1.1000 amid a correction in the US Dollar Index (DXY).
The USD Index has slipped further to near 101.00 as investors are worried that approval of the debt-ceiling increase proposal will impact the long-term rating of the United States economy.
On the Eurozone front, Friday’s preliminary Eurozone Gross Domestic Product (GDP) and German Harmonized Index of Consumer Prices (HICP) carry significant importance as they will be the latest economic indicators before the interest rate decision by the European Central Bank (ECB), which will be announced next week.
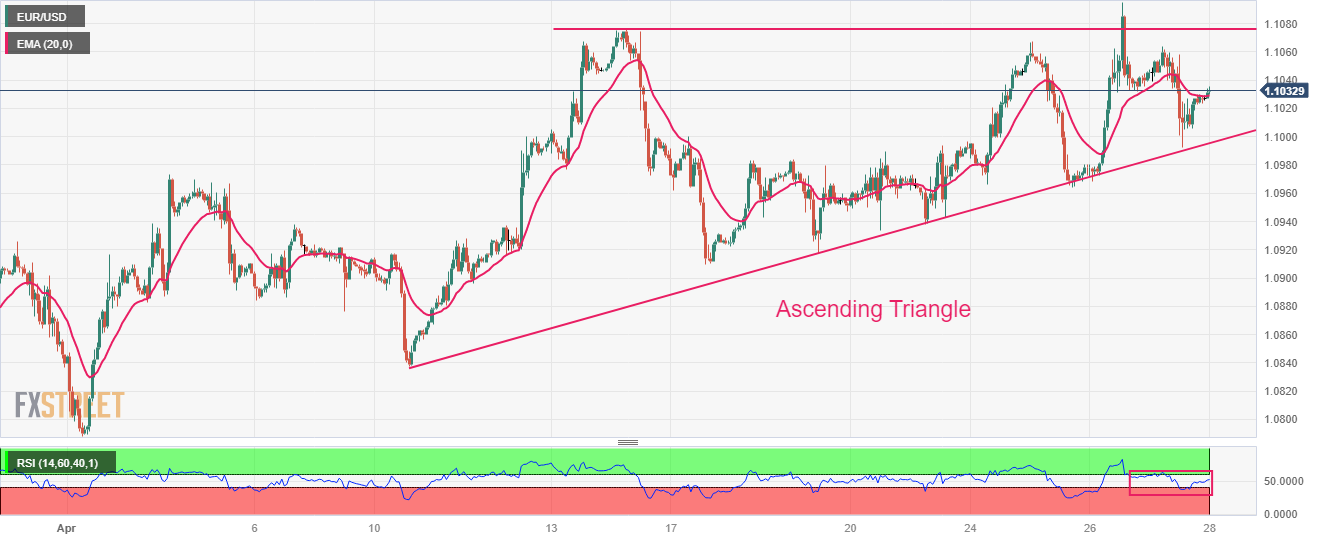
EUR/USD is auctioning in an Ascending Triangle chart pattern on an hourly scale, which indicates a volatility contraction. Upward-sloping trendline of the aforementioned chart pattern is plotted from April 10 low at 1.0837 while the horizontal resistance is placed from April 14 high at 1.0760.
The 20-period Exponential Moving Average (EMA) at 1.1030 is overlapping the asset, indicating a sideways performance.
Also, the Relative Strength Index (RSI) (14) is oscillating in the 40.00-60.00 range. The shared currency pair is expected to show a power-pack action after the release of the Eurozone economic data.
The major currency pair will capture more gains only after decisively surpassing the round-level resistance of 1.1100. An occurrence of the same will drive the asset towards a fresh 13-month high at 11.85, which is 31 March 2022 high followed by 28 February 2022 high at 1.1246.
On the flip side, a downside move below April 12 low at 1.0915 will drag the asset toward April 10 low at 1.0837 and April 03 low at 1.0788.
EUR/USD hourly chart