GBP/USD Price News: Snaps two-day uptrend as 200-day EMA probes buyers
- GBP/USD fades bounce off the five-week-old support line, mildly offered of late.
- Bearish MACD signals suggest another attempt to break short-term support.
- Monthly horizontal resistance, December’s peak adds to the upside barriers.
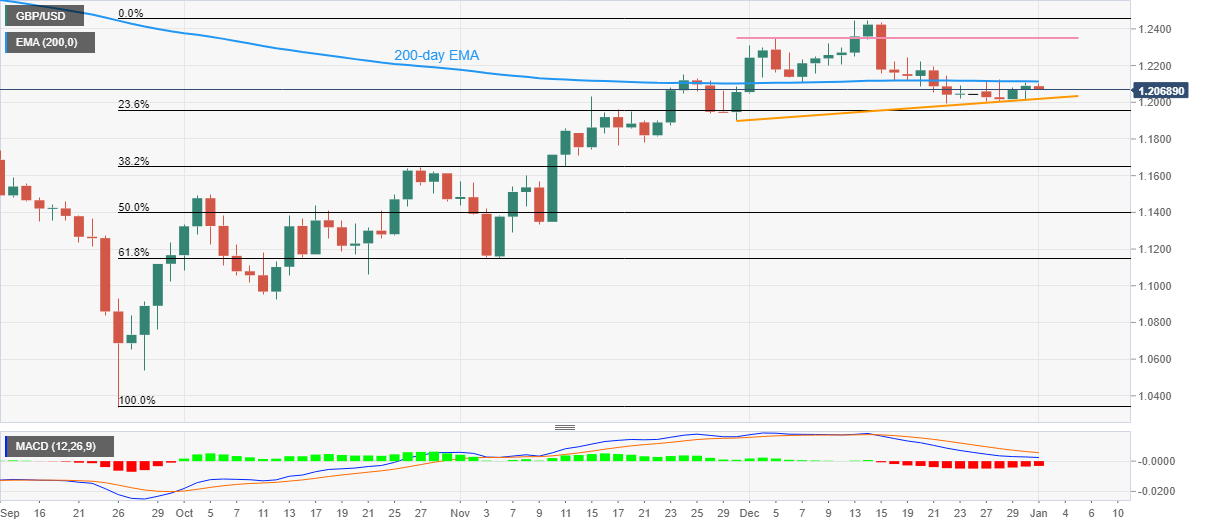
GBP/USD renews its intraday low near 1.2070 during the first loss-making day in three, despite the market’s inaction during early Monday.
In doing so, the Cable pair takes a U-turn from the 200-day Exponential Moving Average (EMA) to recall the bears. Also keeping the GBP/USD sellers hopeful are the bearish MACD signals,
It’s worth noting, however, that a one-month-old ascending support line, close to 1.2020 by the press time, restricts short-term GBP/USD downside.
Following that, the late November swing low near 1.1900 could act as the last defense of the GBP/USD.
In a case where GBP/USD remains bearish past 1.1900, the odds of witnessing a slump towards the 38.2% Fibonacci retracement level of September-December 2022 upside, near 1.1650, can’t be ruled out.
Alternatively, a clear upside break of the 200-day EMA level surrounding 1.2115 could propel GBP/USD towards a one-month-long resistance line, close to 1.2355 at the latest.
Should the GBP/USD bulls occupy the driver’s seat past 1.2355, the previous monthly peak surrounding 1.2450 should gain the market’s attention.
Overall, GBP/USD is likely to witness a downside but the room towards the south appears limited.
GBP/USD: Daily chart
Trend: Limited downside expected