

Silver Price Analysis: XAG/USD clears sold resistance, eyeing the 100-DMA around $19.60
- Silver (XAG/USD) advances sharply in the New York session after hitting a weekly low of $18.79.
- XAG/USD remains neutral-to-downward biased, though a break above the 100-DMA will pave the way to $20.00.
- Short term, the XAG/USD could clear the R1 daily pivot at $19.58, putting in play the 100-day EMA.
Silver price reclaims the 50 and 20-day Exponential Moving Averages (EMAs) on Tuesday amidst broad US Dollar weakness, as risk-perceived assets advance while US bonds rally. Consequently, US Treasury yields fall, a tailwind for the white metal. At the time of writing, XAG/USD is trading at $19.37, above its opening price by 0.77%.
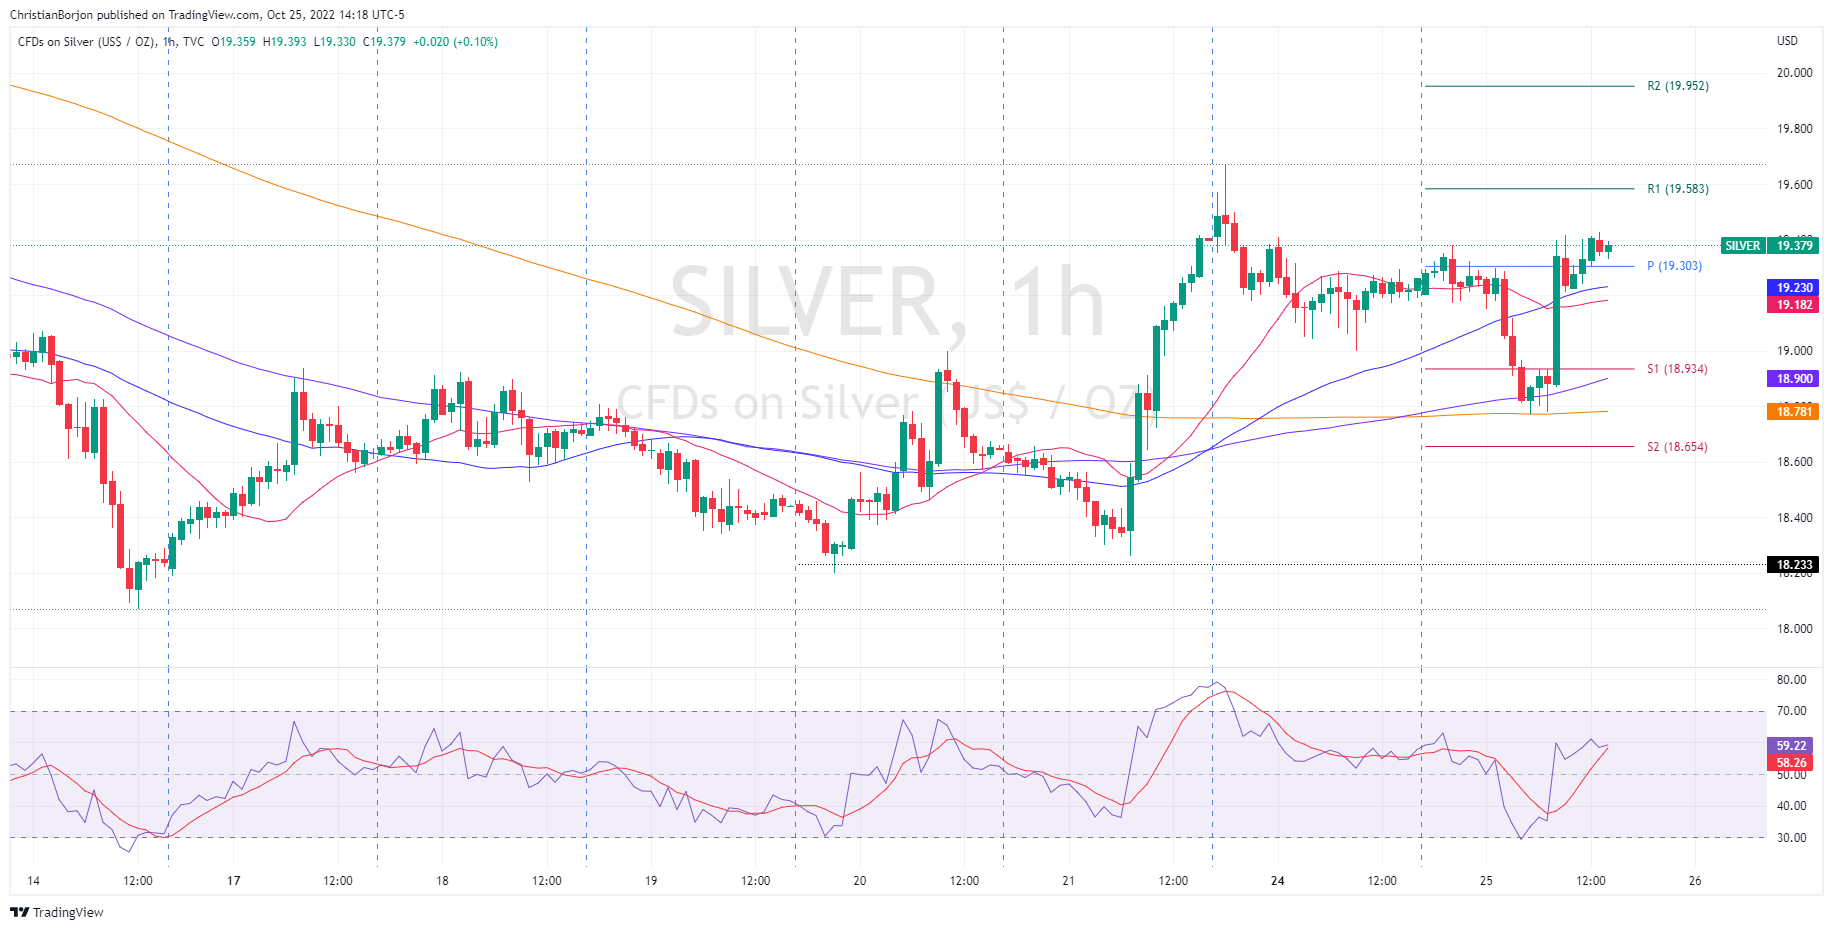
XAG/USD Price Forecast: Technical outlook
The XAG/USD daily chart portrays silver as neutral-to-downward biased, even though it reclaimed the 20 and 50-day EMAs. For XAG/USD buyers to further cement the case of turning the bias to neutral, they need to reclaim the 100-day EMA at $19.61, which could send XAG/USD rallying to $20.00 a troy ounce, before testing the 200-day EMA at $21.65. Additionally, the Relative Strength Index (RSI) at bullish territory, with a minimal-bullish slope, suggests prices could aim higher, opening the door for a test of the 100-day EMA.
In the near term, XAG/USD is neutral-to-upward biased, as depicted by the hourly chart, with prices oscillating around the daily pivot level at $19.30. The Relative Strength Index (RSI), around 58.64, is in bullish territory, though directionless. Therefore, XAG/USD might consolidate amid the lack of a catalyst.
Upwards, the first resistance would be the R1 daily pivot at $19.58, followed by the October 24 high at $19.67, ahead of the R2 pivot level at $19.95. On the flip side, the XAG/USD first support would be the confluence of the 50 and 20-EMAs at $19.23 and $19.18, respectively, followed by the S1 daily pivot point at $18.94. Break below will expose the 100 and 200-EMAs, each at $18.90 and $18.78, ahead of the S2 pivot level at $18.65.
XAG/USD Key Technical Levels